Transporting some stuff:
Those who rely solely on my posts -- or anybody's posts -- without continued and continual study of the source material are very likely to fail. Is it quick? No. Is it easy? No. Is it simple? Extremely. But it's not fool-proof.
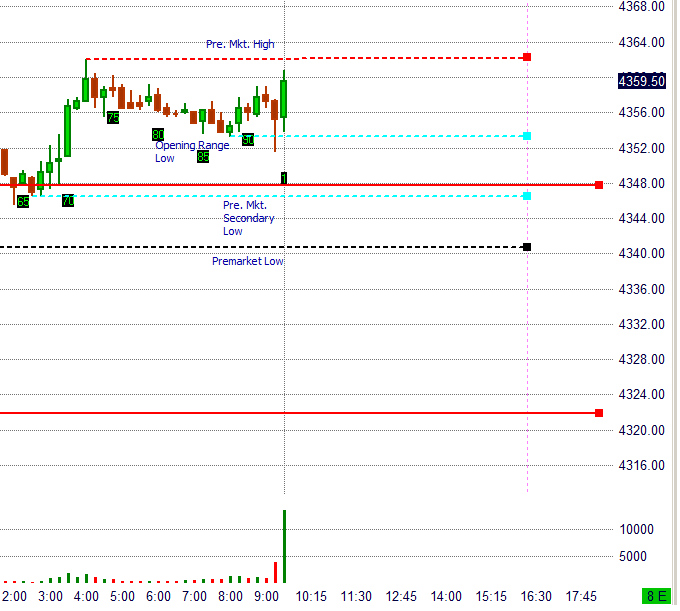
Regarding yesterday's activity, those who don't know what to do with the following, particularly with regard to entering a trade, have not spent a sufficient amount of time in study, especially the source material. Will this come up again? Yes. It came up Monday. It may come up again today. Those who are prepared will do well. Those who aren't, won't.


Those who have studied the source material will recognize a climax and a secondary reaction at potential support. Those who haven't, even though they were told in advance to look for them, won't.
I suggest, therefore, that those who remain confused Ctrl+F W's course for "climax", "secondary reaction (or just "secondary")", "hinge", "equilibrium", and "springboard". If after all that everything continues to remain a mystery, some other approach should be investigated.
Those who rely solely on my posts -- or anybody's posts -- without continued and continual study of the source material are very likely to fail. Is it quick? No. Is it easy? No. Is it simple? Extremely. But it's not fool-proof.
Regarding yesterday's activity, those who don't know what to do with the following, particularly with regard to entering a trade, have not spent a sufficient amount of time in study, especially the source material. Will this come up again? Yes. It came up Monday. It may come up again today. Those who are prepared will do well. Those who aren't, won't.
Those who have studied the source material will recognize a climax and a secondary reaction at potential support. Those who haven't, even though they were told in advance to look for them, won't.
I suggest, therefore, that those who remain confused Ctrl+F W's course for "climax", "secondary reaction (or just "secondary")", "hinge", "equilibrium", and "springboard". If after all that everything continues to remain a mystery, some other approach should be investigated.
Last edited: