Everyone hates draw downs (those periods when you're losing money whilst trading). If only there was a way to reduce their severity and length....
Quite a few people seem to think that "trading the equity curve" is the answer. The basic idea is that when you are doing badly, you reduce your exposure (or remove it completely) whilst still tracking your 'virtual' p&l (what you would have made without any interference). Once your virtual p&l has recovered you pile back into your system. The idea is that you'll make fewer losses whilst your system is turned off. It sounds too good to be true... so is it? The aim of this post is to try and answer that question.
This is something that I have looked at in the past, as have others, with mixed results. However all the analysis I've seen or done myself has involved looking at backtests of systems based on actual financial data. I believe that to properly evaluate this technique we need to use large amounts of random data, which won't be influenced by the fluke of how a few back tests come out. This will also allow us to find which conditions will help equity curve trading work, or not.
Here is an excerpt from my results. It turns out the key characteristic of any system is the autocorrelation of returns.
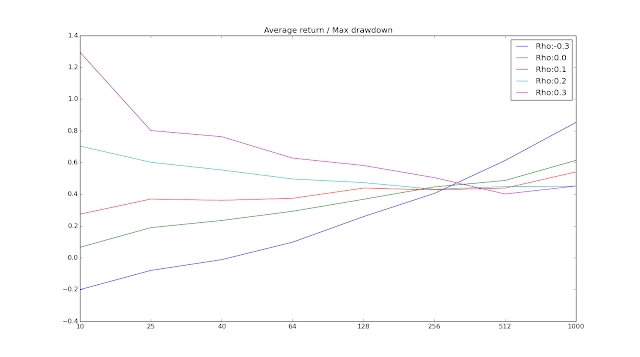
X-axis: Length in days of moving average used for equity curve filter. "1000" (far right point) means no filter is used.
Y-axis: Average annual return / maximum drawdown (averaged over 200 random draws of 20 years of daily data)
Cost level: Expensive futures market / spread bet / cheap underlying equity
Rho: Autocorrelation parameter
Conclusion
The idea that you can easily improve a profitable equity curve by adding a simple moving average filter is, probably, wrong. This result is robust across different positive sharpe ratios and levels of skew. Using a shorter moving average for the filter is worse than using a slower one, even if we ignore costs.
There is one exception. If your trading strategy returns show positive autocorrelation then applying a filter with a relatively short moving average will probably improve your returns, but only if your trading costs are sufficiently low.
However if your strategy is a trend following strategy, then it probably has negative autocorrelation, and applying the filter will be an unmitigated disaster.
This is just an excerpt. Full results and explanation in the usual place
http://qoppac.blogspot.co.uk/2015/11/random-data-evaluating-trading-equity.html
Quite a few people seem to think that "trading the equity curve" is the answer. The basic idea is that when you are doing badly, you reduce your exposure (or remove it completely) whilst still tracking your 'virtual' p&l (what you would have made without any interference). Once your virtual p&l has recovered you pile back into your system. The idea is that you'll make fewer losses whilst your system is turned off. It sounds too good to be true... so is it? The aim of this post is to try and answer that question.
This is something that I have looked at in the past, as have others, with mixed results. However all the analysis I've seen or done myself has involved looking at backtests of systems based on actual financial data. I believe that to properly evaluate this technique we need to use large amounts of random data, which won't be influenced by the fluke of how a few back tests come out. This will also allow us to find which conditions will help equity curve trading work, or not.
Here is an excerpt from my results. It turns out the key characteristic of any system is the autocorrelation of returns.
X-axis: Length in days of moving average used for equity curve filter. "1000" (far right point) means no filter is used.
Y-axis: Average annual return / maximum drawdown (averaged over 200 random draws of 20 years of daily data)
Cost level: Expensive futures market / spread bet / cheap underlying equity
Rho: Autocorrelation parameter
Conclusion
The idea that you can easily improve a profitable equity curve by adding a simple moving average filter is, probably, wrong. This result is robust across different positive sharpe ratios and levels of skew. Using a shorter moving average for the filter is worse than using a slower one, even if we ignore costs.
There is one exception. If your trading strategy returns show positive autocorrelation then applying a filter with a relatively short moving average will probably improve your returns, but only if your trading costs are sufficiently low.
However if your strategy is a trend following strategy, then it probably has negative autocorrelation, and applying the filter will be an unmitigated disaster.
This is just an excerpt. Full results and explanation in the usual place
http://qoppac.blogspot.co.uk/2015/11/random-data-evaluating-trading-equity.html
") ), and then use the $400K to trade with (of which incidentally you'd only about $100K for margin), but you'd trade as if you had $1 million in the account (so a $40K loss would mean reducing your risk by 4%).
), and then use the $400K to trade with (of which incidentally you'd only about $100K for margin), but you'd trade as if you had $1 million in the account (so a $40K loss would mean reducing your risk by 4%).