You are using an out of date browser. It may not display this or other websites correctly.
You should upgrade or use an alternative browser.
You should upgrade or use an alternative browser.
Trading NQ via Price Action
- Thread starter k p
- Start date
I was half way done with typing up this whole post, complete with illustrations about how amazingly well the 50% levels worked today... like really very well, and how even though a 50% level can penetrate, if price so happens to turn, it is often just as good at providing the continuation of the move. (Db made a great post the other day about how traders feel one way when price respects a 50% and level turns, but the panic sets in when price penetrates a 50% level and still turns. I mark this on my chart with the green arrow.) But I just said screw it. My job here isn't to teach, I'm not trying to convince anyone of what works or what I know, my job is to get out of this rut that I'm in.
Saying all that though, here is a chart that is a mess with things outlined that I think are pertinent with red arrows outlining opportunities, but just all thrown in together so it may not make much sense. I saw most of them in real time, but no confidence to do anything about it. Some illustrate a simple RET when price drops above or below a key level, others are for the bounce at a key level, and still some are to show how price respects the 50% level and hence a trade can be taken off there. (I show three 50% retracement levels but there were a couple more)
Its funny how in trying to prevent a loss, I am doing the exact opposite. I want to see price show that its making a solid move first, but this isn't the safest place to enter sometimes. These RET entries work really well many times, but just as often, a 3 or 4 point stop can stop you out, or the closest swing high or low is just too far away. If anything, why the hell not just take a trade right at the extreme at the slightest sign of hesitation and assume the support or resistance level will hold? If I'm wrong, a 2 point stop should be plenty. (I show this with the blue arrow. Once we have such an extended range and price comes so close to Resistance, a 2 point stop would be plenty if a short is taken right at the top. This also works well in conjunction with the trend line breaking... not before I'm seeing.) When I wait for the RET entry, the 2 point stop is not nearly enough. The desire to not be wrong, and the desire to not lose money is causing that very same thing I'm trying to avoid.
Going forward, I think I will just focus on taking my trades and just going for a standard 1:1 trade. At extremes, a 3 point stop will be more than enough, and a RET entry would dictate a stop value that is based on a swing high or low. Then I will just leave the trade to finish how ever it does. Much of my losses are simply from the fact that any profit has usually been taken for ticks... just ticks... whereas the losing trades are taken for the full 3-5 stop (if not even more!) So I think before I can even trade as I should and hold on for any length of time, I have to get this fear of being in a trade out of my system. Once I see that I can actually make half decent entries in real time, then I can focus on letting the market tell me when to get out and not just take the 1:1 profit. But if I see that my entries still suck and I don't even get 1:1 at least half the time, then its back to the drawing board yet again.
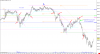
Second chart shows how a SL drawn across the tops of the daily bars provided quite a nice opportunity. That very top of the daily bar at 4268 is exactly where we had that long congestion level before we finally turned down.
Saying all that though, here is a chart that is a mess with things outlined that I think are pertinent with red arrows outlining opportunities, but just all thrown in together so it may not make much sense. I saw most of them in real time, but no confidence to do anything about it. Some illustrate a simple RET when price drops above or below a key level, others are for the bounce at a key level, and still some are to show how price respects the 50% level and hence a trade can be taken off there. (I show three 50% retracement levels but there were a couple more)
Its funny how in trying to prevent a loss, I am doing the exact opposite. I want to see price show that its making a solid move first, but this isn't the safest place to enter sometimes. These RET entries work really well many times, but just as often, a 3 or 4 point stop can stop you out, or the closest swing high or low is just too far away. If anything, why the hell not just take a trade right at the extreme at the slightest sign of hesitation and assume the support or resistance level will hold? If I'm wrong, a 2 point stop should be plenty. (I show this with the blue arrow. Once we have such an extended range and price comes so close to Resistance, a 2 point stop would be plenty if a short is taken right at the top. This also works well in conjunction with the trend line breaking... not before I'm seeing.) When I wait for the RET entry, the 2 point stop is not nearly enough. The desire to not be wrong, and the desire to not lose money is causing that very same thing I'm trying to avoid.
Going forward, I think I will just focus on taking my trades and just going for a standard 1:1 trade. At extremes, a 3 point stop will be more than enough, and a RET entry would dictate a stop value that is based on a swing high or low. Then I will just leave the trade to finish how ever it does. Much of my losses are simply from the fact that any profit has usually been taken for ticks... just ticks... whereas the losing trades are taken for the full 3-5 stop (if not even more!) So I think before I can even trade as I should and hold on for any length of time, I have to get this fear of being in a trade out of my system. Once I see that I can actually make half decent entries in real time, then I can focus on letting the market tell me when to get out and not just take the 1:1 profit. But if I see that my entries still suck and I don't even get 1:1 at least half the time, then its back to the drawing board yet again.
Second chart shows how a SL drawn across the tops of the daily bars provided quite a nice opportunity. That very top of the daily bar at 4268 is exactly where we had that long congestion level before we finally turned down.
Attachments
![NQH15 NQ-201503-GLOBEX [CV] Daily #13 2015-02-06 13_54_36.214.png](/et/data/attachments/131/131192-25b4066ff1769e0635bd53e9247d97aa.jpg?hash=JbQGb_F2ng)
I will just focus on taking my trades and just going for a standard 1:1 trade. At extremes, a 3 point stop will be more than enough, and a RET entry would dictate a stop value that is based on a swing high or low. Then I will just leave the trade to finish how ever it does. Much of my losses are simply from the fact that any profit has usually been taken for ticks... just ticks... whereas the losing trades are taken for the full 3-5 stop (if not even more!) So I think before I can even trade as I should and hold on for any length of time, I have to get this fear of being in a trade out of my system. Once I see that I can actually make half decent entries in real time, then I can focus on letting the market tell me when to get out and not just take the 1:1 profit. But if I see that my entries still suck and I don't even get 1:1 at least half the time, then its back to the drawing board yet again.
I like that you finally have a plan.
Does it include a rule about how long you have to wait (20minutes? 30minutes) before you start improvising?
That's where the fear comes from. Not having a plan.
Will you be reporting back...
I was half way done... but I just said screw it.
There's no difference between trading and posting.
Posting might be an easier category to explore while you develop the discipline to follow a plan.
Before testing yourself again... in the market.
I wouldn't go as far as saying that I have a solid plan, but perhaps just working on my biggest problem thus far which was that I take losses but not wins.
I don't actually think I will be posting much, not until I reach some level of proficiency/consistency.
Yes, not having a plan is a huge part of the fear, but then I simply don't understand what all of these journals would be about. I said last week I think it was that these shouldn't be trading journals, but more so, "building a plan" journals. The consensus seems to be that nobody should be trading, even SIM trading, if they don't have a solid plan. If they do have a solid plan and all trades are taken as they should be, then the trader should be profitable. If not, then his plan is clearly failing somewhere, so its back to making the plan.
But this then therefore makes the trading journal almost irrelevant because it would only document if what should be done, was done. If not, then this is something to explore, and the journal would therefore be more of a psychological examination.
My point though is that most seem to be trading, live or SIM, while in the process of making their trading plan, but since I was called out for this, and rightfully so if I want to be strict, then everyone here should be held just as accountable. I think the journal of Jas is about the only one where there appears to be a solid plan, and the discussion focuses on if it was followed or not. Everyone else, myself included, either takes trades or doesn't based how they feel, how much money they lost, what they think looks good, etc. So in this respect, this is done all wrong.
Going forward, I think I will still be doing it wrong, so I don't think I want to subject myself to any comments that may result, but I do want to build up some good habits of following a trade through. This is why I mentioned just focusing on 1:1 targets. I can very easily take a 3 point loss, but I've had trouble even getting to 3 point profits, and many of my trades would have gotten there if I just let them. So I think I want to just focus on this. As NoDoji has been pointing out, there is an element of excitement, but not in a good way. I have to find a way to get over this, to get comfortable with being in a trade without it affecting me.
The other big realization for me is what I think about going into a trade. The trouble I'm having is that I think of it in terms of "if I enter here, I'm saying that the market will move in my direction instantly". But this is clearly all wrong and I have to get into the frame of mind of thinking that "if I enter here, the chance of the market moving favorably in my direction is better than it instantly reversing on me."
Even more so, I have to train myself to think that if I enter here, right here, then if it goes against me by only a few points, I've gotten in at such a good area that the loss will almost completely invalidate the trade. Usually I'm entering in places that have really shown the market to already be moving in a direction, but the slightest retrace takes me out, and then the market continues in the original direction anyway. Because I'm unwilling to take a bigger loss and hence a larger stop, I have to be willing to enter before its obvious, when I have less information about the trade. I simply have to get comfortable with not knowing, but taking a risk that has favorable odds. So many of my issues point to personal/psychological stuff and I have to get over this before I can even dream about capturing 30-50 points.
k p, remember fortydraws' advice.. don't think of entries yet, observe price for a while to get a feel of its ranges, its inflection points, etc.
Once our observations can validate what we anticipate to happen, I guess that would be the time to start figuring out possible points of entries and exits.
Once our observations can validate what we anticipate to happen, I guess that would be the time to start figuring out possible points of entries and exits.
I find it very difficult at this point to do this to be honest. I just cannot separate the observation phase from the entry phase at this point. You see, I feel as if I'm being pulled in different directions. On the one hand we have the camp of people who say to observe, and even Db has said that once you observe, knowing what to do with it become obvious. Then you've got the other camp that really stressed so much uncertainly of all this, but knowing that the probability of one thing happening over the other is high. I just don't know how to meld these together.k p, remember fortydraws' advice.. don't think of entries yet, observe price for a while to get a feel of its ranges, its inflection points, etc.
Once our observations can validate what we anticipate to happen, I guess that would be the time to start figuring out possible points of entries and exits.
This is partly I guess why I was asking about all trades taken in the past few days from anyone! I asked this because I thought it would be a big help to me to see how often these guys who are killing it are in and out. I wanted to know if they either have such a good sense of where to enter that they are right 80-90% of the time, which is remarkable, or if they really hunt around for the best entry and it takes a few times before the market does finally move in their direction.
I guess in some ways, this heavy reliance on observation makes it sound like with enough observation, you're almost forecasting. This is what keeps me in that state of mind of sounding like I'm looking for the perfect trade as NoDoji points out. The way Db and 40D seem to trade, it sounds like they do find the perfect trade. If each entry produces a trade that is profitable 80-90% of the time, then I'd say this is quite the perfect trade. Given that NoDoji states that she has lots of losses, I'm left to assume that her win rate is closer to 50%. But, and this is a big but, her risk:reward ratio is more than likely 1:4 at least. So being successful only half the time but gaining 4 times as many points as are lost on half of the trades is exceedingly profitable.
Now I guess where I need to go with this is just to say shit, I have no idea what's gonna happen. But here I am at this level that has proven to be resistance before, so if I take a short right at this level, at the slightest bit of hesitation, after price has gone sideways long enough, after my supply line has broken, then if price goes against me 2 points and breaks above this level, I can be happy to call this trade a loss. If I wait for price to drop 5 points before thinking about a short, wanting to first see the market turning down, now I have to worry about price going up to test again, still not invalidating the short, but stopping me out for sure.
I have to get comfortable with risk, I have to get comfortable with not knowing what will happen, but entering in a place where I have the smallest risk and best chance for price moving in my direction.
No worries, k p.. just do what you feel is right for you.I find it very difficult at this point to do this to be honest. I just cannot separate the observation phase from the entry phase at this point... ...Now I guess where I need to go with this is just to say shit, I have no idea what's gonna happen... ...I have to get comfortable with risk, I have to get comfortable with not knowing what will happen, but entering in a place where I have the smallest risk and best chance for price moving in my direction.
All the very best and have a good weekend ahead!
I was half way done with typing up this whole post, complete with illustrations about how amazingly well the 50% levels worked today... like really very well, and how even though a 50% level can penetrate, if price so happens to turn, it is often just as good at providing the continuation of the move. (Db made a great post the other day about how traders feel one way when price respects a 50% and level turns, but the panic sets in when price penetrates a 50% level and still turns. I mark this on my chart with the green arrow.) But I just said screw it. My job here isn't to teach, I'm not trying to convince anyone of what works or what I know, my job is to get out of this rut that I'm in.
I'd say that 50% figure is a *rough guide only*. It's not a hard and fast rule. If it were it would work 100% of the time, and it obviously doesn't. It's a signal, meant to be combined with other signals, but not an "if this, do that 100% of the time" signal. There's other things going on which I'll try to detail my opinion of towards the end.
Saying all that though, here is a chart that is a mess with things outlined that I think are pertinent with red arrows outlining opportunities, but just all thrown in together so it may not make much sense. I saw most of them in real time, but no confidence to do anything about it. Some illustrate a simple RET when price drops above or below a key level, others are for the bounce at a key level, and still some are to show how price respects the 50% level and hence a trade can be taken off there. (I show three 50% retracement levels but there were a couple more)
You need more than just that 50% signal and retraces. You need more context to get a better understanding of *market structure*. Lack of confidence is a symptom of not having that. Now while overall trends to not dictate a hard future - they surely provide a helpful context from which to make distinctions above how the more local trends might play out. When price approaches these key areas - you have to make observations about the "fight" that occurs around those points and *past attempts* at breaking through the trend. I'd say that at almost every single channel edge you should be prepared for the price to break out as a possibility. The market seeks balance. The edge of channels can be considered a potential imbalance area and the price is going to do something about it (which is why we see the trends as trends in the first place).
Its funny how in trying to prevent a loss, I am doing the exact opposite. I want to see price show that its making a solid move first, but this isn't the safest place to enter sometimes. These RET entries work really well many times, but just as often, a 3 or 4 point stop can stop you out, or the closest swing high or low is just too far away. If anything, why the hell not just take a trade right at the extreme at the slightest sign of hesitation and assume the support or resistance level will hold? If I'm wrong, a 2 point stop should be plenty. (I show this with the blue arrow. Once we have such an extended range and price comes so close to Resistance, a 2 point stop would be plenty if a short is taken right at the top. This also works well in conjunction with the trend line breaking... not before I'm seeing.) When I wait for the RET entry, the 2 point stop is not nearly enough. The desire to not be wrong, and the desire to not lose money is causing that very same thing I'm trying to avoid.
Okay, 2 point stops isn't going to work in NQ unless you have the smoothest trend possible. I think you're getting chopped up in general by using stop losses that are just plain too tight. You've probably lost more money through tight stop losses than you would have lost had you used wider SLs because said wider SLs would have got you stopped out *less* and made you *more* money over time. There's risk aversion, which people should always have, and then there's just being loss averse and getting killed by a thousand cuts. You can tighten your stops after things have moved in your direction and while volatility ultimately determines stop width, I think you'd be better off with a 3-5 pt SL by default.
Going forward, I think I will just focus on taking my trades and just going for a standard 1:1 trade. At extremes, a 3 point stop will be more than enough, and a RET entry would dictate a stop value that is based on a swing high or low.
Do not do this. 1:1 is just going to kill you over time - particularly with a loss aversion problem.
Then I will just leave the trade to finish how ever it does. Much of my losses are simply from the fact that any profit has usually been taken for ticks... just ticks... whereas the losing trades are taken for the full 3-5 stop (if not even more!)
Loss aversion/take the profit when it's there + "it's gotta do this, the rules say so - shit it just hit my stop, wtf?." Kill that monkey instinct. It's burning you left and right. One side is scared of losing the food on the table and the other is overly confident in what the "rules" say.
So I think before I can even trade as I should and hold on for any length of time, I have to get this fear of being in a trade out of my system. Once I see that I can actually make half decent entries in real time, then I can focus on letting the market tell me when to get out and not just take the 1:1 profit. But if I see that my entries still suck and I don't even get 1:1 at least half the time, then its back to the drawing board yet again.
You definitely need to get the fear factor of holding a trade out of your system. You can't even continue with that. I think you're suffering from general fear of backstabbing based on past trades burning you. This is a "damaged" effect. At this point you probably believe the market is designed to screw you over at any opportunity. In a way, there's a small amount of truth to it - but in reality it's more apt to screw over those who are over-confident or scared.
Second chart shows how a SL drawn across the tops of the daily bars provided quite a nice opportunity. That very top of the daily bar at 4268 is exactly where we had that long congestion level before we finally turned down.
I don't trade NQ that much these days but I think you're missing wider context in how you're approaching these supply/demand lines. For instance, the area around pushing past a "50% retrace" seems alarming but you're not considering why in the big picture that might be the case because your context here is too narrow IMO.
Here's an overall "macro" chart where I plotted general channels a week or so ago and following charts where the "camera moves in." I'm just going to leave all trend lines on the chart regardless of when I drew them because a: some of them have meaning longer than one expects (you'll notice traces of price behavior around them), b: I can't be bothered to clean every little one up.
My interpretation of a month wide big picture:
My interpretation of the more recent picture (part of which is what is being discussed):
Friday:
I guess my point here is before making moves based on retraces and 50% rules, consider where price is in a larger context. Consider too prior movements price has made in comparison to the current movement.
When it's looking you dead in the face, size up and go in for the kill.
Sorry, I left a note in there about being premarket which was just plain wrong as I had my times mixed up. It was during market time - and that lends even more weight to the "a decision has been made around the longer term trend edge" IMO. The only thing I traded NQ-wise during that day was the remaining sell off after lunch as I was paying more attention to CL.
One could have just shorted this thing at 4260, 4255, 4245, and closed out at the end of the day. Easy to say in hindsight of course, but I'd consider that lack of breaking through the major trend to be a sign of overall weakness for the *day*.
One could have just shorted this thing at 4260, 4255, 4245, and closed out at the end of the day. Easy to say in hindsight of course, but I'd consider that lack of breaking through the major trend to be a sign of overall weakness for the *day*.
Wow.. so much thought put into your reply... thanks!I'd say that 50% figure is a *rough guide only*. It's not a hard and fast rule. If it were it would work 100% of the time, and it obviously doesn't. It's a signal, meant to be combined with other signals, but not an "if this, do that 100% of the time" signal. There's other things going on which I'll try to detail my opinion of towards the end.
So first, for sure the 50% I'm just using as a guide. I have looked at so many thing and honestly, I'm almost paralyzed by too much. I need less. When I have too much, its hard to enter a trade, and its usually far too late anyway. This last post of mine basically had so many other things stripped that I had been looking at. I didn't mean for it to be in isolation of everything else I would have on my chart, it was just one of those things that either give a trade an extra vote of confidence or not.
Okay, 2 point stops isn't going to work in NQ unless you have the smoothest trend possible. I think you're getting chopped up in general by using stop losses that are just plain too tight. You've probably lost more money through tight stop losses than you would have lost had you used wider SLs because said wider SLs would have got you stopped out *less* and made you *more* money over time. There's risk aversion, which people should always have, and then there's just being loss averse and getting killed by a thousand cuts. You can tighten your stops after things have moved in your direction and while volatility ultimately determines stop width, I think you'd be better off with a 3-5 pt SL by default.
I agree that 2 points will stop out the average trade, except if its take right at the very edge of an extreme. You see, I mentioned this as a way out of my rut. I'm wanting for trades to work out, hunting the perfect trade almost, so I wait for a bit more confirmation, but this extra confirmation gives me more price risk. Then I'm also trying hard to prevent loss, and by doing this, I'm having to take on more price risk. What I see is that I'm looking for a trade to work out most of the time with hardly any risk... an impossible task! (it also doesn't help that I don't ever take at least a few points of profit)
So my thinking here is that if I'm really scared of the loss so much, and if I want to be right, then I have to short pretty damn close to what I think is resistance and a 2 or 3 point stop will allow for that. Waiting to enter on a RET below price bouncing off R means having to sweat through sideways action perhaps, or a return to test R again.
On your chart you even mention an area where one could pre-emptively short and take a small loss if wrong. This is what I'm suggesting as well. Take the trade at the slightest inclination of it showing weakness at a level where you expect weakness and get the best damn price possible.
This for sure won't be part of a final plan, just more of the training wheels stage. If you look at some of my charts where I've got a bit crazy with constant ins and outs, you begin to see a pattern. You see that I take 3-5 points in losses, but that I never take 3-5 points profit, usually 3-5 ticks! It is simply a system designed to lose money.Do not do this. 1:1 is just going to kill you over time - particularly with a loss aversion problem.
When you teach a kid to ride a bike, you don't expect them to go around the block on their first try. You give them training wheels and you're happy if they just make it peddling to the end of the driveway (they of course shouldn't fall over given the training wheel)! Taking a bunch of trades and making sure to at least take a 1:1 will hopefully lead at worst to break even, and perhaps even profits if I'm decent with entries over 50% of the time. Once I see that I can make proper entries based waiting for the best places to trade, then I can focus on the bigger gains.
Yes.. I need to get it out of my system. I don't believe the market is out to get me, but I do believe that given the trades I've taken, I'm out to get me! (and I have succeeded!) I think its a wonderful experience to see how low I could go, how much I could damage myself, to see how stupidly I can take trades at the end of the day. But I am ready for the next phase now.You definitely need to get the fear factor of holding a trade out of your system. You can't even continue with that. I think you're suffering from general fear of backstabbing based on past trades burning you. This is a "damaged" effect. At this point you probably believe the market is designed to screw you over at any opportunity. In a way, there's a small amount of truth to it - but in reality it's more apt to screw over those who are over-confident or scared.
What I find interesting about your charts is the amount of diagonals (your trend channel lines), but hardly any horizontal lines. I shouldn't say hardly actually because they are there, and like you say, you left the channels on all the charts as you zoomed in so its looks busier than it probably is. But I look much more at the horizontal levels, and following Db, especially the ranges, and what price does when it leaves a range or approaches a previous range. The bitch of course is when the price action isn't "clean" and price consolidates around a level without a clean bounce or penetration.
Its great that we are talking the same language though. I do have to chuckle though because one of your notes on the chart is that it looks/feels weak. When I said that in the past... I've been ripped apart! LOL.... What does "looks weak" mean? And can you even begin to describe what "feels weak" mean???
 This is the essence of behavior I'd say, but nobody talks about this. I've tried to show this on a 5 sec chart, because I want to see it, but this didn't get much discussion. Sure it has to do with how the right tick moves as you are watching price around a key level, but there its hardly any firm discussion about this. Its like saying in order to learn to swim, you just have to move your arms and legs... now go jump in the water!!!
Thanks for the detailed post!