You lost me here emini... what jigsaw link???Funny I clicked on the jigsaw link and then the first link about order flow and whoever was speaking goes the first time you try to learn this you are going to be bad at it and basically says to just sit and watch with a smile on your face and DO NOT sim trade yet it will build too much negativity (paraphrasing). He then goes on to say we can and can't tell you what to see.....I'd check that link out.
You are using an out of date browser. It may not display this or other websites correctly.
You should upgrade or use an alternative browser.
You should upgrade or use an alternative browser.
Trading NQ via Price Action
- Thread starter k p
- Start date
LOL.. opps.. I totally missed that with the posts moving so quickly in my journal today. My observation clearly needs work!the link provided by fourtywinks, I guess
")
Kp,
Where's your 5 min chart? Let me see your thought process on that.. All I see is the 1 min and the 5 sec..
Where's your 5 min chart? Let me see your thought process on that.. All I see is the 1 min and the 5 sec..
Excellent point. It would all be a bit hindsight now unfortunately. In fact, my hindsight price action reading skills are excellent, but none of that is helping in real time or when trying to make money from it.Kp,
Where's your 5 min chart? Let me see your thought process on that.. All I see is the 1 min and the 5 sec..
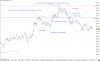
Here is what I can mark up now. The difficult is knowing what happened first in real time. So although I mark this up as if the bar first hits a high and then a low, perhaps price first hit low, then hit high, and hit low again. I can of course see where price "entered" and "exited", but not really how it moved up and down hence why this is a bit hindsight.
Attachments
Excellent point. It would all be a bit hindsight now unfortunately. In fact, my hindsight price action reading skills are excellent, but none of that is helping in real time or when trying to make money from it.
Here is what I can mark up now. The difficult is knowing what happened first in real time. So although I mark this up as if the bar first hits a high and then a low, perhaps price first hit low, then hit high, and hit low again. I can of course see where price "entered" and "exited", but not really how it moved up and down hence why this is a bit hindsight.
I think I see one of your problems.. It seems like you are thinking too much when the market is live.. I think you should make a simple strategy for now.. Here's something that you could start with:
1) Study market behavior (context).. What is the market doing at the moment? Trending? ranging?
2) Find areas where the market is likely to bounce from (Range) or Find areas where the market is likely continue in the same direction (Trend).. example areas - moving averages, trend lines, horizontal support..
3) When prices reach those areas on your 5 min chart, then look at the short term chart for patterns that usually form around those areas..
4) Figure out whether you are going to hold for 1:1 or 1:2 or better..
There really is this truth and elegance to watching what price has done in the past and where it has done it, and then seeing what traders to with it once price gets here again. Traders are no different than people buying stuff, and hence why Db calls this all an auction market. My ability to read this is lacking, and worse is my ability as to what I'm going to do about it.
You hit the nail on the head when you bring up statistical testing and rigorous discipline. Patterns are much easier to test, but I don't believe have a better win ratio because they fail to take into account the context and even more so, behavior. A pattern has to look perfect, the behavior has some wiggle room I believe and if you're in tune with reading this, you're set. It is after all the behavior that sets up the pattern. If I was to do this all mathematically, I might as well be a hedge fund or quant, which is even way further beyond my means than reading behavior!
Yes, 40D provided how to observe, but I still never see the end result. Show me what one does with this. I don't deny that I need to observe more, but when working on what to do about it, the reply always seems to be that once I observe enough, I will know. (way too spiritual for me!)
kp. There are so many things I could say about this soap opera, but in my humble opinion you're too focused on how other people are doing it down to every little detail. You want to trade discretionally; then you will have to accept that there will be some more fuzziness compared to if you'd trade mechanically.
I want to remind you that there are a couple of stylized facts for asset price processes in the academic literature (do the google research if you're interested). In essence you've got properties like long tails, volatility clustering (i.e. expansion vs contraction; i.e. it is a mean reverting process), and long term memory.
It is more or less those properties that you are trying to exploit here. You can do that in several ways, and there are many threads and books about it, but just the other day we had Db repeat it again (http://www.elitetrader.com/et/index...w-a-straight-line.287955/page-34#post-4080349):
And it occurs to me that virtually all the journalists I read could do quite nicely if they did nothing more than wait for higher lows to go long and lower highs to go short. Lines or no lines. And if they coupled this tactic with a basic knowledge of support and resistance, which is something else hardly anyone understands, they would likely not only turn the corner but speed straight for the Promised Land.
Keep it simple. Don't focus on the minutiae. Don't hunt perfection. If you want to trade discretionally and get this "feeling" you're talking about (but at the same time you're hinting above how this approach might be too "spiritual" for you...), then pick a bar interval that gives you the time to reflect over the situation. You will never be able to internalize anything if you're just stressing out all the time; you have to be open and receptive.
Keep it simple. You're familiar with the market's properties. Now just wait for the right behaviour (and you've heard also this from ND, Db, and countless others before): if it doesn't move [as expected], get out.
and of course that green line at 88, the previous day high is acting as both support and then resistance... but once again... what are you gonna do about it???
You could always trade the retracement on the 1 Min around 4180 if you felt like it.
It is back in the middle of the channel though
Yes.. this is an excellent outline and essentially what I'm trying to do. The trouble I have is where price congests around that area that I'm watching. Its that penetration, then bounce back up that bothers me, especially when the bounce back up is also rejected.I think I see one of your problems.. It seems like you are thinking too much when the market is live.. I think you should make a simple strategy for now.. Here's something that you could start with:
1) Study market behavior (context).. What is the market doing at the moment? Trending? ranging?
2) Find areas where the market is likely to bounce from (Range) or Find areas where the market is likely continue in the same direction (Trend).. example areas - moving averages, trend lines, horizontal support..
3) When prices reach those areas on your 5 min chart, then look at the short term chart for patterns that usually form around those areas..
4) Figure out whether you are going to hold for 1:1 or 1:2 or better..
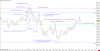
I was watching very closely this action here that I show in this chart. It worked like clockwork based on what I'm looking at. Its a shame the OH and that other R level were so close, and I'm not even sure if these levels mean anything now, but I can think of firm rules around this price action that would make me act.
But alas, when it doesn't work, and still doesn't produce a good move in the opposite direction, I get discouraged.