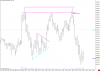
Oh.. I didn't mean to imply that I was asking you to answer it directly, but given that we are looking for rejections on a 5 min or hourly chart, I'm trying to figure out what that rejection can look like. Sometimes price stops just before the level, like the short on Friday just below 4204 at roughly 1430 hrs. So as price is dropping, we didn't even hit the level. 40D's friend took the short at roughly 5 points below the ultimate high, and about 6 points below where the level was that we were watching. A short this far away from the level I consider dangerous because what would constitute a reason to exit? If price should happen to climb back up to 4202 again, or even try for 4204, does this mean the short is no good? Absolutely not because this could just be the retest. So do you hold the short through a 6 point loss waiting to see if it goes above 4204? Do you exit real quick if it doesn't drop right away, but perhaps be ready to re-enter again?
I absolutely understand the importance of trading at these extreme levels, but the trick is figuring out what it means for you to be able to say with some confidence that traders have rejected this price level and are heading lower, or if this is just another RET in an otherwise uptrending market.
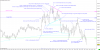
Yes, so I guess I am trying to find out if this level will hold. In terms of time frame, I can see how the 5 min chart prevents you from micro-trading and is a great chart to look at for levels, the hourly chart even more so. But I of course also follow the 1 min chart, and I have been looking at the 5 sec chart to see if anything in there makes sense for me to make an entry that is both indicative of the direction and also very close to the watched level so that my entry isn't so far away. We can never be sure that price will drop right away, but we can also never be sure that it will go above that high we are watching. So getting in as close to that level as possible seems key.
With 40D outlining that his friend took the short at this red arrow here, but is only watching the 5 min chart, then he is clearly watching the behavior of the right tick to let him know to short here. (Contrast this with how many other traders would trade which would be an entry above or below a bar) So the question keeps coming back to the behavior contained within that bar, how those ticks move, that lets a trader know the level has been rejected or not.
I absolutely understand the importance of trading at these extreme levels, but the trick is figuring out what it means for you to be able to say with some confidence that traders have rejected this price level and are heading lower, or if this is just another RET in an otherwise uptrending market.
Yes, so I guess I am trying to find out if this level will hold. In terms of time frame, I can see how the 5 min chart prevents you from micro-trading and is a great chart to look at for levels, the hourly chart even more so. But I of course also follow the 1 min chart, and I have been looking at the 5 sec chart to see if anything in there makes sense for me to make an entry that is both indicative of the direction and also very close to the watched level so that my entry isn't so far away. We can never be sure that price will drop right away, but we can also never be sure that it will go above that high we are watching. So getting in as close to that level as possible seems key.
With 40D outlining that his friend took the short at this red arrow here, but is only watching the 5 min chart, then he is clearly watching the behavior of the right tick to let him know to short here. (Contrast this with how many other traders would trade which would be an entry above or below a bar) So the question keeps coming back to the behavior contained within that bar, how those ticks move, that lets a trader know the level has been rejected or not.

")