In fact, his charts in his thread are very helpful in guiding us to observe what needs to be observed. I certainly hope he'll continue to post more charts.
Perhaps you can help me out here fourtiwinks because I need another set of eyes as my observation skills are completely useless. (fortydraws, I just want to use your chart illustrate the difficulty I'm having with this so it may sound like this is against you in some ways, but it isn't at all. These points I make are just questions in my head.)
So please tell me what you see, because here is what I see.
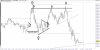
My lines were really quite similar to what Db and 40D had. At "A", we have what appeared to be a high, but then price did break higher, although it dropped below. So although I too had the thick line at roughly 97, I also had the thinner line at 4203.
So when price comes back up to B... which line is in play? Price bounced off beautifully from the thicker line, but this was no longer the high. (It certainly does look to be the high of that trading range that formed, and this would very much be in line with how Db draws his boxes which I spent quite a bit of time on).
The reason I want to point this out though is because I want to contrast this with what 40D said about how he doesn't see a swing low at C. Why doesn't he consider this a swing low? Its quite prominent on this 5 min chart, but its true that its in the middle of all the price action to the left, its not an extreme at this point. But likewise, the line at A is no longer the high a few minutes later because the climb up to 4203, which I shall label as "D", is now the new high. So as price is coming up to B, he points out that we should be watching this thicker line, but it no longer represents the high.
Moving along, when price is coming down to E, I asked about this price action around here because it looked quite choppy. But 40D responded that he doesn't see the swing low at C as being of any significance. I understand that price never retraced more than 50% of the down move, but I just don't understand how the low at C isn't given any consideration. If its because it wasn't the ultimate low of the day, then my brain tells me when price approached the high at B, this wasn't the ultimate high of the day anymore either... the high now stood at D. So in the first case, the swing at at A which forms this line has significance, but in the second case, when price approaches the swing low at C, this doesn't matter. It seems to me that we should either use the ultimate extremes (ie. the highest high of the day up to that point or the lowest low of the day up to that point, but this would contrast with looking for the highs and lows of ranges as they develop), or include everything, which I would think should therefore make the action at C of importance.
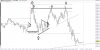
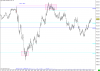
Now the second point of where I'm failing badly at observation I guess is this. Lets look at F. Here price has just cleared the area at B where it turned before. So once we break above 4197, it looks solid. Sure we have the ultimate high at D of roughly 4203 to contend with, but we are breaking out above B. On the next chart I post which has both a 5 sec chart and the 150 LOC chart, I see reasons to accept this breakout higher and go long, since we did after all break above a level that 40D outlined as being important and that I saw as important as well. If was important enough for the short you could take at B, so why isn't it important enough for a long that could be taken above this level at F.
But what happens next? We don't go far, we do in fact not even make it to the previous high and stop 1 point short of this level before turning down. So ok... this is pretty significant. But at what point do we see this, and at what point do we do something about it?
I know 40D or Db might cut me up for looking for entries, but heck, this is my journal, so I'm gonna let it fly!
")
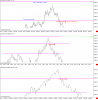
I plot where his friend took the short at 97.50 on both a 5 sec chart, 1 min chart, and 150 vol LOC chart. And you know what, I cannot find any reason why the short is here. (its not 1 point below the bar of a 1 min chart.... its not below a RET we might see on the 5 sec chart, and its not below the low of a wave that would be seen on the 150 LOC chart.) Who knows, maybe he just entered late, but it sounds like he must have very solid rules if he has done so well so my observation skills are just not seeing this short.
The main point of this though isn't where the short was taken, but that something in the observation phase told him to short, but I don't know what. If its a failure to push past 4203, the short is too late. If its price dropping below that prominent level at 4198, the short is too early.
Anyway, I'm not looking for a reply from 40D or Db because I realize I'm talking about entries which they have objected to (plus I think they are both done with me.. LOL). Nor I guess am I really looking for a reply from you either and its not like I want to put you on the spot. I just wanted to illustrate that given the important points that 40D outlines, and observing what happens at these areas, the observations that I make don't lead to any ability to act on it. By the time I can say for sure that yes, price rejected this level, its far too late to do anything about it, and at that point, the observation would tell me that I can't enter now because anything is likely to happen (ie. a retest higher or continued drop).
Perhaps I will fail at this because I cannot separate the observation phase from looking for entries. But I think if someone is excellent at observation without looking for entries, this will be just as useless.