One more day of analysis posted to my journal and then its hibernation mode. I've got a lot of shit to say but since I wasn't trading, I've got time.
FIRST CHART
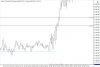
So first we had that huge rise up overnight. I saw it in real time, and when we broke 4172, there was huge penetration and I think a great buying op. We spiked at 93.75. When I woke up, I saw the poke above... here is the 5 min chart. That spike above happens at 0610 on my chart... so lets see what is going on there.
In the 5 sec chart... you see the spike, but there is no wave to entice buying after the initial spike up. It drops right down... and sure the spike down below the pink line recovers above the line, but there certainly is no follow through. Now I don't plan to trade during the overnight session like this and the price action is very thin... but since I got the 5 sec chart, I'm using it to study.
I should also point out that price hit 97, and although I don't have these lines drawn on this 5 min chart, on the hourly chart the level of 97 is quite pronounced.
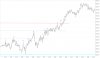
SECOND CHART
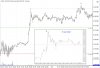
Now lets move to today to the hourly chart which shows what I'm watching. Below A we have what is our ON high, which actually matches up well with the low from 3 days ago. This is at 4197 and is incredibly close to that other level I have at 4200, both of which I will be watching. I am expecting price to go up... but lets see what happens.
THIRD CHART
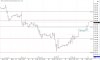
Next is my 1 minute chart. I outline a swing point at B that I will go into detail about on the 5 sec. Below I also have a support level, but I'm still unsure how to exactly draw these. On the one hand I have a line that captures where most of the trades reversed, but the spike down is about 2 points lower... but I will just make sure to keep my eyes on both if we head down that way.
FOURTH CHART
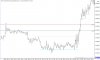
This one is the 5 sec and if anyone cringes that this is where most of my analysis happens... I only want to use this at the open and at important levels! The idea is that it won't matter so much what's going on between the levels... I just want to trade from one level to the next unless price makes a serious turn at only half way or something like this.
B - This is where that swing point on the 1 minute lines up. Now this is such a minor point... and most of the important levels have to be taken from 5 minute and hourly charts, but it is interesting enough that price was turned away here at the open, just two ticks below.
C - Because of this, I think a short is justifiable here. I would have to be nimble, but at least for me, the reaction is there, the RET, the wave.
D - Things are fine until price spikes up to here... but there isn't a reason to sell yet because I want to see where the wave/reaction/RET falls.
E - We come down to here, essentially forming a double bottom, just above that area I already marked as support. Hmmm...
F - If I'm nimble enough, I would say to go long above that bar, so roughly here.
G - Interestingly enough, if I'm just watching the 1 min chart, there is a reason to go long here, at 4190, and this is where it falls on the 5 sec chart. But by just watching the 5 sec chart, I see a reason to be long at 87 or 87.50.
H - We turn down from where the OH is at 93.75, just below it, drop below that R line, so this is a bit unfortunate, but if my long was entered at F, I'm still not in trouble.
I - This is a bit of a worry because I have a little RET here for a short that happens below the R line (this isn't a major level though so I need to be careful seeing too much in this 5 sec chart and focus on the rejection that already happened at the bottom). I'd have to keep an eye on my 1 minute chart to guide me a bit here... who knows if I could in real time as the swing low which happens to be at E isn't penetrated, but I just want to point this out as a potential problem in what I'm looking at right now.
J - By here though, I've got a higher low, and if I'm still holding the long, then I'm good, and if I did get into that short at "I", I need to get out and switch.
K - Here we are flirting with the OH, but even though we penetrate a bit and bounce off a bit, there is no RET below this, if anything, we still have HH's and HL's.
L - Here we have a bounce from this 97 level, but there is no follow through below.
M - Another bounce, and yet another higher low.
N - Now that we have cleared this level, and there is a tiny test down, perhaps this is good enough for a buy... but its not exactly a wave.
P - Here is the first down wave, and if price should happen to penetrate this again, then it might be time to exit. But this should only be the case if its because price bounced off an important level.
Once price has taken off like this, switching to the 1 minute is prudent. These 5 sec charts I only want to be looking at when we are at important levels.
As it so happens, price came down to this exact level a couple of minutes after this chart ends here and turned precisely here. I wouldn't sell just because price poked below this level, I would wait for that reaction, for the RET below. So what I'm saying is that if price pokes below a swing point on the 1 minute chart, I will look at what's happening at this poke and if the selling wave crests below the point (ie. where the support line would be drawn) and drops further down then its a reason to get out. But if the crest comes back up above the low of the 1 minute which would be above the support line, then its still good.
(Oppps... I just realized I don't have the level of 4200 marked on the 5 sec chart. As you can see though, at 4200, there is no reason to worry about selling, and point P is even price price stops its little down wave... so buying about there is justified, or adding to the contracts once we see that buyers aren't rejecting this level of 4200 which was support before and might have been resistance now.)
And that's enough for now... I'm off to hibernate. Shame no trades were taken... I blame everyone else!
")
 I am really good at using my feelings to catch tops and bottoms you know. (and they say its really hard to do... as if!)LOL
 .... I don't mind posting as long as its not about my work!)