You are using an out of date browser. It may not display this or other websites correctly.
You should upgrade or use an alternative browser.
You should upgrade or use an alternative browser.
Trading NQ via Price Action
- Thread starter k p
- Start date
Since this is my journal.... I get to go first!
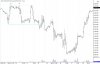
Outlined on my chart are actually two sets, with two different time frames. The red blocked areas show both a ranging environment first, and then two trending areas. Contained within, we have ranging environments on two lower time frames outlined in blue.
In terms of words, it would be a case of HH's and HL's for an up trend, LH's and LL's for a down trend, and roughly equal highs and lows for a ranging market.
And sadly, this looks to be be the NQ chart of the past few days with an ample amount of opportunity!
")
Fine as far as it goes. But it's all hindsight. Which is fine at this stage. One can't define what does not yet exist.
But you must now determine just what it is about these two states that make them distinguishable. In this way you will be able to recognize them as they occur in real time. Otherwise it's couldawouldashoulda.
Well I just think his approach is flawed and his choice of words could have been much better.Samuel is not trying to persecute you. He's trying to inspire you.
This is a problem worthy of being solved. The other stuff doesn't matter. If you like, I can click the button that undo's my earlier like of Samuels posts but I assure you in his own way he has your journey in his heart as his own and is just offering his way of inspiring you so u don't have to suffer the lessons he and all of us have had to suffer.
This problem is absolutely worthy of being solved without a doubt!
Lastly, I think I might just have to suffer like all of you have had to. Its much better to learn now than have beginner's luck and fail once I think I'm invisible if I had luck on my side initially.
Yup.. nothing like being able to do this in real time. How about now... its all about the failures.... is this closer?Fine as far as it goes. But it's all hindsight. Which is fine at this stage. One can't define what does not yet exist.
But you must now determine just what it is about these two states that make them distinguishable. In this way you will be able to recognize them as they occur in real time. Otherwise it's couldawouldashoulda.
And of course once we are trending, its making lower lowers and failure to make a higher high or even match the previous high, hence a lower high.
Attachments
Never once said it was easy but you know kp I won't post ever again on your journal .You keep doing what you believe and I will do the same. By the way if every moment in the market is unique and every outcome is random and we have no way of knowing what is going to happen next why do you need 100 examples of every trade you want to make .
slugar, I will miss your posts. You are an inspiration. You affirm areas of importance that I know I need to be focusing on. I know I will see more of you posts elsewhere so I hope in time given enough healing that you might reconsider this misunderstanding which exceeds my ability to determine exactly what happened And i hope that someday u wil find it in your best interests to want to contribute here. Bless you sir.
Since this is my journal.... I get to go first!
Outlined on my chart are actually two sets, with two different time frames. The red blocked areas show both a ranging environment first, and then two trending areas. Contained within, we have ranging environments on two lower time frames outlined in blue.
In terms of words, it would be a case of HH's and HL's for an up trend, LH's and LL's for a down trend, and roughly equal highs and lows for a ranging market.
And sadly, this looks to be be the NQ chart of the past few days with an ample amount of opportunity!
There are 4 very nice trends within the first red rectangle with a 5th nearly as nice trend beginning just before that very same first red rectangle.
Yes, there was just incredible opportunity these past few days. I don't have my charts loaded up right now, but often so many of the best moves happen during the Euro session, so when I'm awake for the NY session, price has already gone up so far that there is often a deeper test. So although I think it should go up based on the trend, I have to be prepared for it to go down first and work through some trades, and then if it initially goes down, you want to make sure that a new trend up is really in play before you start buying too soon in that initial downtrend. Lots of competing stuff sometimes, and the best moves also happen after I might already be at work and don't happen in the first 90 minutes before I tune out.Look at the 11th bar in your last red rectangle! Strong failure to make a new low. I see this happening almost every week. Why don’t you just buy this??
Yup.. nothing like being able to do this in real time. How about now... its all about the failures.... is this closer?
And of course once we are trending, its making lower lowers and failure to make a higher high or even match the previous high, hence a lower high.
You say "is this closer" as though there is an answer in the back of the book. There isn't. What is or is not "right" depends on what you want to do with it.
For example, at the left edge of your supply line, price begins ranging. It does so for about 18 bars before dropping to your demand line. Since the number of points is here irrelevant, can you take advantage of this shift from ranging to downtrending? If so, how?
And any or all of those who've been eager to help are welcome to chime in.
Switching to my charts to make it easier to draw what needs to be drawn.
Good old SLA would have us draw the initial tight DL on the way up. Ideally we would have a higher low to connect, but here, price never makes a higher high so we can't fan this super tight line. The first RET happens overnight, so can't do anything with this, but the second op for a short at the second red allows for a solid trade on this hourly chart given that we are rejecting going higher and formed the double top at B with A.
Good old SLA would have us draw the initial tight DL on the way up. Ideally we would have a higher low to connect, but here, price never makes a higher high so we can't fan this super tight line. The first RET happens overnight, so can't do anything with this, but the second op for a short at the second red allows for a solid trade on this hourly chart given that we are rejecting going higher and formed the double top at B with A.