Thanks so much! It is good to hear that this is benefiting others. There really is no point in putting on a brave face and not being completely honest with some of the stupid stuff that may be running through my head. ND has been excellent as well in sharing how she used to feel, and how trading still is almost unnatural, yet she blocks it out because she knows she has the power of statistics on her side. You commenting how much you appreciate me keeping this going is contribution enough!Hey kp, you definitely are in this regard!
Fyi, your journal is a treasure for a struggling trader like me, both for the invaluable help from experienced traders and for your candid struggles. I can't contribute meaningfully, but I really appreciate what you are doing.
May you achieve the breakthroughs needed to be a successful profitable trader.
Best wishes!!")
You are using an out of date browser. It may not display this or other websites correctly.
You should upgrade or use an alternative browser.
You should upgrade or use an alternative browser.
Trading NQ via Price Action
- Thread starter k p
- Start date
...You commenting how much you appreciate me keeping this going is contribution enough!
Glad to hear that!
Thanks so much! It is good to hear that this is benefiting others. There really is no point in putting on a brave face and not being completely honest with some of the stupid stuff that may be running through my head...
At least you're brave enough to face them publicly. And many of your "stupid stuff" are commited by me too.. and other struggling traders, I believe..
But do slow down if you need to, especially since DB and other experienced traders are asking you get statistics, and this will require a lot of your time to test your assumptions..
Simplest of updates today as I'm too busy.
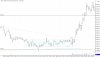
A - SL drawn, and the swing point that connects here is nicely far away from the open, hence this SL is well established for me.
B - DL is here, and this level at 4198 I can see has been R then S (more easily seen on a 5 min chart), and its tested here nicely as support.
C - If I look at the hour just before the open, for a while it looked like a hinge was forming, but at the same time, I can make a case for a trading range. (I got this idea from FeetFirst when he commented on my Oct 28 chart, but Db of course always outlines what's happening just before the open) The dip down at the open hits the bottom of this range so this is good confirmation. To be honest though, I didn't see this as much of a range before the open, I was mostly just watching the trendlines, but I think if a range before the open can be identified, a break above this range will be just as good as a break above or below a trendline.
This is also what's hitting me. I really am finally becoming well acquainted with a RET. Once I understand every tick of a RET entry, this exercise that I'm doing can be so easily modified/applied to any other type of trade, be it a BO from a hinge, a BO from a range, or a BO above or below a major trendline.
O - At the open, we try down first, not quite hitting the DL, but certainly hitting the low of that range. Until this low was put in though, the limits of the range might be said to be a bit hazy, but now it beautifully matches up.
D - BO above the SL, but we come right back down. We could track a long entered here at the breakout level when price came back down, but I don't know where my stops would be on this type of trade.
E - These two consecutive tops, I'm not sure if I'm ready to call this a RET yet. I know Db would say this qualifies, but I gotta see it for myself first if it works well enough. We have clearly broken up, so I'd be itching to get into a long and hence any excuse might do, but I gotta make sure this works just as well as the typical RET.
F - Here it is. Long entry one tick above at 09.25, stop at 6.75. You're never in a loss, and we would hit 1x, 2x profit without too much trouble.
G - OH can be said to provide a bit of congestion, but this is no different than anywhere else. Heck, even at E the bars are a bit wider.
The OH does have to be considered though. I know ND says the she looks at if the trade has a profit target that can be attained before hitting any sort of resistance. If I waited until this RET at "H" to enter, here the OH might be too much of a deterrent. Also, if I don't take the first RET, this would be stupid and fear based, and any RET thereafter is just that much more prone to fail.
And we go higher.
SUMMARY
Today was easy. I am very eager to get down to also stats where I find out what percentage of days trend right off the open like this. I say to myself every day that I will do this because I think its really important to know the distribution of trending days right after the open versus days where we are stuck in a range or wide channel. I know its not even half I don't think, so I can't expect every day to be easy like this. But when you have a set of rules, it just doesn't matter. The rules take care of everything for you and let me tell you, that will be a sense of relief.
Perhaps the biggest relief is knowing where the stop is. When I entered a trade blindly, the money loss combined with being not wanting to be wrong is a factor that really makes you hold for so much longer than you should, and this is of course what kills you. So knowing where to get out, and accepting it without reservation would have more than easily prevented so many of my loses.
Also, once I know what my risk is and I enter a profit of at least 1 times my risk, so many of my 1 tick profit trades could have easily gone to 2 or 3 points if I just acknowledged that I will at least get out what I risked. I sat through so many trades sweating a loss of 2 or 3 points, and the minute when price finally came back towards me I was out for a tick profit. Of course with price coming back towards me it just took off way into profit, so I suffered through the loss but didn't enjoy the profit. Having these two rules, a well defined stop, and a profit target of at least 1x the stop would I think leave me not nearly as far down in the account as I am. So essentially, doing just one thing right will have major implications, but to become consistently profitable, you gotta do about 95% of the right things I think!
Attachments
So I spent a bit of time tonight looking up the "fame" journals at the suggestion of Db. Silly me, I thought I was looking for a journal by a member named "fame", or that I was looking for a journal that had "fame" in the title. I fortunately clued in pretty quick!
A huge list came up with Hall of Fame threads. I had read through lescor's journal before, but scanned it one more time tonight. (I found it interesting that some of those guys Db argues with back and forth in the P&R forum might actually be expert traders themselves... hence why they have time to focus on politics!)
Anyway, I found this page quite interesting where he highlights 155 winning days and 89 losing days, and still makes $361K for the year.
http://www.elitetrader.com/et/index...ut-day-after-day.187730/page-160#post-3714089
This is big for me because in the past few days, I kept being hampered by the idea that I needed to keep looking for more rules, or for a better setup whenever it failed a few times. Although I fully understand that there will be some loses, I just wanted to find a more "perfect" trade, or a way to eliminate putting on a bad trade. I was simply focusing too much on the scratches, and this is preventing me from seeing the potential.
Anyway, other than replying to any questions or comments, the next journal update will be some firm stats. I will of course watch the open in real time tomorrow, but I won't waste time doing a write-up. The chart will simply be added to the backtesting folder.
I like that I'm finally getting down to really fully investigating this retracement. I know that there will be instances where a tight stop will stop me out for a loss right before price takes off in my direction, but I really need to find out how much of a problem this will be in my 100+ charts and if there will be a way to lessen this via a larger stop or waiting for the second RET entry, or..... The firm stop loss will of course also keep the losses well defined and keep me from further loss in case price really can't move any further. I think this statistical analysis of everything that a retracement can do will be a huge stepping stone forward.
I fortunately clued in pretty quick!A huge list came up with Hall of Fame threads. I had read through lescor's journal before, but scanned it one more time tonight. (I found it interesting that some of those guys Db argues with back and forth in the P&R forum might actually be expert traders themselves... hence why they have time to focus on politics!)
Anyway, I found this page quite interesting where he highlights 155 winning days and 89 losing days, and still makes $361K for the year.
http://www.elitetrader.com/et/index...ut-day-after-day.187730/page-160#post-3714089
This is big for me because in the past few days, I kept being hampered by the idea that I needed to keep looking for more rules, or for a better setup whenever it failed a few times. Although I fully understand that there will be some loses, I just wanted to find a more "perfect" trade, or a way to eliminate putting on a bad trade. I was simply focusing too much on the scratches, and this is preventing me from seeing the potential.
Anyway, other than replying to any questions or comments, the next journal update will be some firm stats. I will of course watch the open in real time tomorrow, but I won't waste time doing a write-up. The chart will simply be added to the backtesting folder.
I like that I'm finally getting down to really fully investigating this retracement. I know that there will be instances where a tight stop will stop me out for a loss right before price takes off in my direction, but I really need to find out how much of a problem this will be in my 100+ charts and if there will be a way to lessen this via a larger stop or waiting for the second RET entry, or..... The firm stop loss will of course also keep the losses well defined and keep me from further loss in case price really can't move any further. I think this statistical analysis of everything that a retracement can do will be a huge stepping stone forward.
I think this statistical analysis of everything that a retracement can do will be a huge stepping stone forward.
Yes, it will and it's something you have to do yourself and make it all your own. If you sat next to Lescor that year and were supposed to put on every trade he did, you'd never do it because it would be hugely uncomfortable for you, just as mirroring Geez back in 2009 and taking 5 losses in a row with him would likely be nigh impossible.
Only you can do the work (and it's a real grind unless you love detailed numerical/pattern analyses) and then make it your own. The very act of doing it will condition you for the next step which is the far greater struggle. But it's the struggle that will give you a shot at becoming a profitable trader as long as you learn to work through the discomfort of the journey.
"The emperor moth is the most majestic species among all the moths. It has wide wings spanning out majestically when it flies.
One day a man found a cocoon of an emperor moth. He took it home so that he could watch the moth come out of the cocoon. He sat and watched the moth struggling to force the body through that little hole. Then it seemed to stop making any progress. It appeared as if it had gotten as far as it could and it could go no farther. It just seemed to be stuck.
The man, being kind, decided to help the moth. So he took a pair of scissors and snipped off the remaining bit of the cocoon. The moth then emerged easily. But it had a swollen body and small, shriveled wings. He expected that the wings would enlarge and expand to be able to support the body which would contract in time. Neither happened! In fact, the little moth spent the rest of its life crawling around with a swollen body and shriveled wings. It never was able to fly. A few days later, it died.
What the man in his kindness and haste did not understand was that the restricting cocoon and the struggle required for the moth to get through the tiny opening was the way of forcing fluid from the body of the moth into its wings so that it would be ready for flight once it achieved its freedom from the cocoon.
Freedom and flight would only come after the struggle. By depriving the moth of a struggle, he deprived the emperor moth of health and freedom." – Author Unknown
Yes, it will and it's something you have to do yourself and make it all your own. If you sat next to Lescor that year and were supposed to put on every trade he did, you'd never do it because it would be hugely uncomfortable for you, just as mirroring Geez back in 2009 and taking 5 losses in a row with him would likely be nigh impossible.
Only you can do the work (and it's a real grind unless you love detailed numerical/pattern analyses) and then make it your own. The very act of doing it will condition you for the next step which is the far greater struggle. But it's the struggle that will give you a shot at becoming a profitable trader as long as you learn to work through the discomfort of the journey.
What a lovely story ND. I have heard it before, but it works quite well when used for trading. I don't in fact even consider it discomfort. Many have posted in my journal (and I think too... LOL) that I was being a tad lazy for not doing the work or expecting someone else to just give me the answer, etc. But to be honest, I just didn't know yet what I was looking for, and you certainly can't find it until you know what you're looking for.
The first time we had this discussion a few weeks ago in terms of MAE and MFE and I tried to draw these things on a chart to illustrate these two values, it was still a bit hazy. Going back even further, just trying to fix the issue of my bar not printing properly because of the time delay made it difficult to move forward. Figuring out why my trendlines appeared to move when going from a 5 minute chart to a 1 minute chart also ate up lots of time until I found a solution.
So I simply wasn't ready for this yet. I consider myself a pretty smart guy, but this almost makes it harder since there is more shit to get over. But I knew I couldn't do it until I had a very clear idea in my head of what I'm going to do and what I'm looking for.
Saying that, its going really very well. I'm tracking a few things, so spending a few minutes on every chart, and then after the first dozen or two, I find another category I want to track, so then I gotta start again. But what I got so far is that at 50 instances of a 5 min line break, 38 times a trade sets up. Out of this, 22 times a 1:1 Reward:Risk works. 14 times we get to 2:1, and 11 times we get to 3:1.
I also tracked a second instance of the 5 minute line break. This could happen if price for example exited the SL first and went up, and no matter what happened, I then saw what happens if on the way down the DL now breaks or the SL breaks again with price coming back down. (these stats I have to go over again as I think I may not have been as strict with this setup in terms of tracking if the SL is break again, or if its the initial DL... nor do I track if a bounce off the DL works version the penetration... just so many variables). Anyway, here I have 18 trades that set up out of 50. 14 of these hit 1:1, 9 hit 2:1 and 7 hit 3:1.
If we look at just the first result, 22 out of 38 times is 58%. A 1:1 profit is small, but since the win rate is over 50%, this is positive. (accounting for commissions of course makes this not as good). Furthermore, this is only the summer months, half of June, July and August. Once I add in data from the fall, I think this number will get better.
Now my 2:1 profit ratio is 37%. If it was 50% for 2:1, bam... I'm in business. Not sure where the breakeven point is for a 2:1 profit:loss ratio, but this isn't horrible I don't think.
I am tracking the conditions before the day, along with a quick description of how the day ended up. So if I start to see a pattern with my pre open conditions and see the day was lousy for setting up a trade, perhaps it will help with knowing to stay out of some trades. And lets face it, the summer months had so much chop.
Also, the winning trades are all based on the height of the retracement. Some might have an entry with a stop that is like 6 ticks. So my profit is only 6 ticks. But hitting profit more often than hitting the loss target will be excellent practice. Lastly, seeing as the difference between 1:1 and 2:1 isn't that great, 22 vs 14 wins, it might even be best to enter 3 contracts and start scaling out at each higher profit ratio.
The act of going through this puts me in the proper trader's mindset. I am reading through Trading in the Zone again when I need to stop looking at charts and numbers, so doing the stats while also reinforcing via Douglas how this is exactly what I should be doing puts me fully on the right path. The fall months will be a goldmine I think for helping the stats get better because the number of trending days seem to increase.
As an aside, my free verison of Multicharts stopped working, so that's a bitch. I got the TWS version working well, but no trading is possible, even in SIM, in this version. So I got the BookTrader in IB TWS to work well for order entry, and the orders do show up nicely in MC. (I can even drag them in MC and hence change them, but I just can't initially put them on. The reason the dragging is important is because I will need to drag the stop loss to just below the RET, and the profit target to either 1x or 2x or whatever it is that I see works best)
I have an IB chart as well beside the Multicharts window to show me a 15 second chart as the TWS version of MC doesn't allow for anything less than 1 minute charts, but there is no way to get a tick chart now.
 (The TWS version of MC designed for IB customers is really dumbed down) You know what though, for the moment, I almost don't even need to see price move. Watching price was killing me emotionally, and often, price always goes against me before hitting my 1:1 profit anyway, coming within a tick of my stop. But when the trade is good, there is lots of buying before the previous swing low is hit, so its important to not move the stop. Looks like all the number crunching will allow for a more hands off approach initially.
(oh ya, the reason why I mention my platform issues is this dumbed down version of MC isn't allowing me to load up expired contracts, and I don't have enough charts saved. I wanted to at least do Sep-Nov for last year as well as all the fall session from this year thus far... so I'm hoping the support staff can get me loading up these charts on expired contracts. Using IB for charting is just too cumbersome for me. Drawing and scrolling, compressing and expanding... all of this in MC is a dream)
I would still love to sit beside a really good trader and watch them work though!
")
Last edited:
Keep up the good work KP!
Thanks! The gift of all this work will be to breathe a sigh of relief. Knowing what to do because you have stats to back you up is the only way to release one's self from the torment and agony of emotional trading.
My god... finally finished. So I have results, but a few caveats as well.
1. I tried to be as consistent as possible, but I notice that some charts don't have as much detail on them as I would have liked. I still tried to make sure the trendlines that would be seen on a 5 min chart were drawn properly right before open every time though. Each day is different though, so some days the lines are clear, other days you're making a super tight line that breaks right at the open just because there is no other way to draw the line.
2. I didn't take the trade until the RET bar was fully above or below the trendline. Often there was chop around the trendline, and if this was the case, I waited until a clear RET bar was formed above the line (ie. opened and closed above the line).
3. I used an entry of 1 tick above, and a stop of 1 tick below. After going through all this, I see that a different combination might work better, but you would need hundreds of examples to actually give this statistical significance I think.
4. I could see so many other good trades, but had to wait until the initial lines were broken (ie. If price drops below the DL, and eventually hits a bottom, forms a range, and comes back up, I actually waited until price broke this SL from ON until I could look for a long. The long could be taken much sooner, but for the purposes of tracking the second trade, I waited for this line to break.)
Also, I could see drawing 5 min trendlines after the open would also help set up more trades, but for my first statistical analysis I wanted to just track the very first trade after the open.
Often, price also pretty much rejected a trendline, especially if he trendline was almost horizontal and hence more of a level. That rejection and a standard subsequent retracement would provide a perfect opportunity, but I couldn't take this trade for this analysis because a line wasn't broken. If anything, these were the juiciest trades. Once a level a rejected and price goes off in the other direction, the chances of it continuing after the RET are pretty damn good it seems.
5. Another critical thing to track would be, if I'm stopped out, how often will a reverse trade work. (ie. So suppose I see that my trade based on the RET is 10 ticks for the stop. This makes my profit for a 1:1 also 10 ticks. Now suppose my stop is hit. If at this same moment I put on a trade to go in the new direction, how often can I now reach a 1:1 or 2:1 profit in this direction.) I have a hunch that more often than not, when the stop is hit, there was a chance to make money in the opposite direction. Of course sometimes, your stop is hit and price drops only a few ticks and takes off in the original direction again, so by doing a reverse trade, you might get back to back losses, but if the numbers show that a reversal trade is statistically viable... why the hell not.
6. Its interesting that when I did my update a few days ago, I mentioned a 58% win rate for 1:1. I could have sworn that it would be 80% for all the trades that set up, but when added up, it wasn't quite that high. So there you have it, the brain is terrible at collecting stats. It just wants to remember what it wants to remember and throws out the stuff that makes the number not as good.
So I have a total of 108 charts from June 16 until Nov 14.
75 trades trigger once the conditions for taking a trade are met.
50 trades reach 1:1 profit (66% win rate).
35 trades reach 2:1 profit (46% win rate).
26 trades reach 3:1 profit (34% win rate).
For the 2nd trade, (this could be the result of several things though)
33 trades trigger.
24 trades reach 1:1 profit (72% win rate)
17 trades reach 2:1 profit (51% win rate)
15 trades reach 3:1 profit (45% win rate)
I've got lots of other notes on my spreadsheet, so perhaps there is more info in there, but I can't look at it anymore... and my back hurts!
I find it interesting that the 2nd trade, although sets up way less, has a slightly better win rate, but they both drop off from 1:1 to 3:1 at about the same rate I guess. (I find this interesting because it correlates well..... and so unexpected)
What I gather from these numbers is that the 1:1 win rate of 66% is good enough to trade, but the 46% win rate of 2:1 is actually the better result for making money. Keep in mind that these winning points might be small. The profit is just based on the stop. If that bars are small, the stop might be only 6 ticks, so hitting a 2:1 ratio profit is 3 whole points. But you know... if I'm trading 5 contracts, I would be delighted with 15 points.
The trades that work of course work for many many more points.... far above 3:1. I have yet to add up how many of these days are actually 40+ point days right from the open.
The next thing to look into is does a slightly wider stop produce much better results. We should be looking for reasons to stay in a trade after all, and there are several cases where a couple of ticks below the RET would stop me out but price still continued. Rarely did the trade just make it to 1:1 profit. So if I open up the stops to 2 or 3 ticks, I think I will still hit the 66% win rate, but might cut out some of the losers and give them a change to hit at least 1:1, if not more.
In a sense, what I have done is analyzed the RET to a greater extent, and I have also seen so many other trades that would work beautifully once I put all the stuff I know into a plan. Perhaps the biggest eye opener here is that often times, price will go against the entry, but if there is enough buying power, that swing low used as the stop will never be breached.
So many of my previous loses have been from getting out just because my entry was breached by a few ticks, and hence I was trading my P&L, but not trading what the market was telling me, and it would be saying that the previous swing low is still not breached.
Furthermore, as I have said over and over again, I never took profits, just the loss. My gains were merely ticks, but losses were measured in points. And equally worse, I never took the initial loss, I held for longer "hoping" price would turn around. Sometimes it did, and hence why I got into the habit of waiting. I would sit through a 7 point loss and get out with 1 tick profit! (grrrr.... and worst of all, as price came back down to me anyway, it of course went much further into profit than just the 2 ticks I took.... I have so many 1 tick profit trades)
So the way I see it now, either my small loss will hit, or I will get at least 1:1 profit. Of course the idea is to hold for much much longer, but with a win rate of 66% for 1:1, perhaps the thing to do is move the stop to this 1:1 profit once price goes higher and lock in that profit and ride price up higher.
Ok.. gotta figure out what to do next.
Good job KP - has to be nice to be armed with some semblance of risk/reward stats for a change - ones *you* tested and have complete confidence in. However, gotta admit, I am surprised the 1:1 was successful 66% of the time.
As for what to do next: completely up to you, but how about checking 'context' using something simple like find out if taking these trendline breaks is better after HH, HL for a long etc. Of course you will have to concretely define what constitutes a HH, HL in the same manner you concretely defined how to draw your trendlines.
Good luck on your continued backtesting journey.