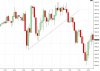
Well I'm trying hard to do my stats, but I'm failing miserably. I'm just not sure what to make of all of these things. Today was a horrible day with so much chop that I had my 5 min trendlines but then I wondered if I should start fanning them of not. Monday and Tuesday were huge trending days, and unless one got into a the long right away and just held all day, then getting into a long again might be tricky.
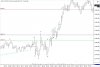
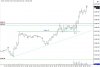
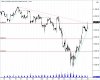
I am trying to make sure to only draw trendlines that are obvious on a 5 minute chart, and then load up the 1 minute chart and see what's happening, but it seems like I have too many cases where I'm just not sure how to categorize what I'm seeing, and if I use context, I still wouldn't want to take some of these trades even though the break might set it up. Plus of course, I am using some 5 min trendlines that are too shallow and perhaps might not be valid. I can draw fairly consistent trendlines going into the open, but after the day starts, I tend to want to do very creative things with them and this is not good for developing a solid plan.
Anyway, I have no stats, but I've got nice visuals. I'm having trouble making sense of all of this if I'm forced to do it within the confines of a very rigid structure. I also have the benefit of knowing what happens in these charts, which is detrimental to this exercise so I'm fully aware of this.
") Neither of you share what it takes to fully transparent. At the very least, which is a huge point, I can evaluate Db's method and see if it can work for me. If you have shared our method with J and Slugar, then this is great for them, but the rest of us cannot evaluate. I suppose if I have some time I can go through your posting history and see if I can find a nugget here or there since you said you've posted charts in the past.
Neither of you share what it takes to fully transparent. At the very least, which is a huge point, I can evaluate Db's method and see if it can work for me. If you have shared our method with J and Slugar, then this is great for them, but the rest of us cannot evaluate. I suppose if I have some time I can go through your posting history and see if I can find a nugget here or there since you said you've posted charts in the past. ") But I do enjoy it when it does happen... I like to see the back and forth... its our little soap opera on ET!
But I do enjoy it when it does happen... I like to see the back and forth... its our little soap opera on ET!