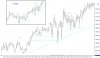
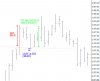
A - Before the open, I stated with this 5 min SL below, and when there was a break, here is a lovely RET to go long. But I know that I need to wait for the open to use my 5 min lines. I use the high just above here to draw my new 5 min SL going into the open.
B - Above here, the solid line in a short term DL, and below, the dashed line, is the 5 min DL going into the open.
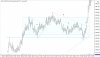
C - At the open, we essentially start dropping down, but I mark in a possible long here, just based on a 15 sec chart because I thought I saw a bounce off the 5 min DL. This is why it appears in the middle of a line, but the trade would have been placed above a 15 sec bar. This long clearly doesn't work, and although a 15 sec chart is even more in the territory of the algos, with the 1 minute chart being already bad enough, this trade is at least based on something that might be important, that 5 min DL.
D - So now we are breaking out below and I'm looking for the RET back up to the 5 min DL but there isn't one. I do although mark in this short, and you can see the tiny little lines above showing a hinge. In the 15 sec chart, (the insert), this hinge is beautiful, and if it was on a 1 minute chart, it would be a solid trade. But this 15 sec chart can be tricky.
I do also want to note that this short would be an SLA short after the break of the tighter DL outlined... the solid cyan line. So along with the hinge on the 15 sec chart and a legit SLA trade, this one makes sense.
E - We come to rest here, and its 8 mins of consolidation. We break up, but no way can a long be considered just yet after a fairly strong move down.
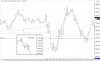
F - I'm watching for that test of the breakout zone, this would allow me to get into a short at a similar level as the break below of the hinge, and get in as the second mouse. The trouble is that these bars close inside the line. I do mark in a possible short, but it wouldn't fill until 3 minutes later in an area that is very much a consolidation again. So for the purposes of my stats, I'm not sure if this is a legit trade to consider or not.
G - Here we break up, but come back down again. Actually, this break up here happens first, and its when prices comes down again that the short at "F" would fill if the trade wasn't removed. Certainly a long above the next bar works. (but this is marked in hindsight) I do remember ND making excellent notes about how when trading a reversal, she waited for a previous congestion area to clear first. Here we have that congestion area, and now I even notice that we can say we tried to go out the bottom of the congestion area and that quickly failed, so this long marked in here just makes sense to try out the top, but this is all in hindsight by now once again. None of what is happening today makes too much sense so I'm certainly not going to try for a trade.
H - Juicy area again... we come to the 5 min SL. On this bar, we have a close below, on the next bar, we have a close above. I can honestly make a case for both trades, hence both are marked in. The long never triggers but the short would. This isn't a BOPB trade mind you, since we never continued with the BO, but often at these 5 min trendlines, we have either a BO or REV, so it makes sense to track both options.
If I entered this trade at 74.50, I would want to put my stop at just above that high that pokes above the SL, roughly where the long entry would be which is 78.75. Not bad, less than 5 points risk.
After this trade fills, it just doesn't look good. The emotions would want to take an exit because look, its 5 bars of higher lows after the entry! But the highs never break the high at H, so my stop loss would never hit before price comes down, so this trade does in fact work.
Now the question of course is where is my exit? My stats should tell me, and perhaps something like a 2:1 or 3:1 would be nice, especially if I end up having a win rate of 50%, but this I have to figure out. Also, I am wanting to actually trade less. I am looking to get myself into a trade that I can hold longer. Today is clearly not the day for one of those types of trades mind you. Given the context today, it is perfectly legit to take profits I think, but if we weren't at the mean of our channel, and if we were in a place where we bounced off strong support on the hourly chart like 2 days ago, then I would be inclined to hold for a huge trend if the price action supported this. I guess you never know if you will get a trending day or not, but in the first 30 minutes, we already went down and all the way back up again, and also the overnight range was quite narrow in relation to the action in the past few weeks.
SUMMARY
Ok.. that's enough for today. I want to start my homework as suggested by ND, so I will try and do this for the past 3 days and post this later today. In case I'm doing it wrong, hopefully she can point it out before I get too far and only have to redo a few days. Essentially I will look at the trades that set up after the open based on the 5 min trendlines, and watch both the BOPB, as well as a possible reversal since this seems to happen if the BO doesn't take.
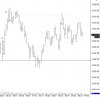
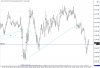
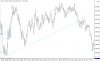
J - As up update on the next chart, we have a bounce off that 5 min SL. At entry at 73.25, with a stop of lets say one point above the bar at 77.50 makes this is a 4.25 risk. So far we have hit a low of 67, which makes this 6.25 points, so roughly 1.5 : 1 in terms of reward vs. risk, but price clearly comes up again. Now if I was shooting for at least a 2:1 ratio, I could still move my stop to BE or even at least take profits at 1 times risk once it dropped lower, but my gosh, this is some serious number crunching.