Sigh... no trading today... but it worked again!
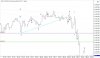
A - This is the first 5 min SL I have.
B - Here is one that is slightly fanned down based on a swing high on a 5 min chart that never made it to the original 5 min SL. The idea is to watch both and see how traders react around them.
C - This is the overnight low, but here it happens to be a double bottom on this second bounce.... so I need to have this in my head.
Ok... all the important parts are in place.
D - 30 mins prior to the open, a valid reason to go short based on the tighter 5 min SL. It does work for a few points but ultimately fails when price breaches the line and closes above it. I think a point profit or at least BE is more than possible. I can always re-short if price should come back up to the line and drop again.
E - So I will now use this higher low to draw an initial DL. Not putting much emphasis on it since its minor, but lets just see what happens.
F - This is where we have the break of the steeper SL and a close above, but we are still below the first SL.
G - Here is another valid short that would fill. Once again, it goes against me, but barely makes a higher high.
O - At the open, we have broken that DL, but go higher.
H - We get to within a hair of the SL on this bar below H. So here is the trade. The bar low is at 34 and the bar high at 36.25. If I use 2 ticks away as entry, I can be short at 33.50, and exit one tick above this bar so an exit of 36.50, hence a 3 point loss, not bad. (Funny this is that 2 ticks might be the worst. ND uses 1 tick, so although she might be sucked into a losing trade sometimes, her exit costs less. Db teaches to use 1 point, so getting sucked into a trade is less likely unless it is really going in your direction, but the loss is now greater. With 2 ticks, it might actually be combining drawbacks of both ways, and hence be worse than going with either a point or a tick)
It fills on the next bar, goes down 4 points but comes back up. Ouch. If I was trading this, I might have been inclined to run for the exits before I had a loss on my hands. Many traders often do say to not move your stop-loss to BE too early, and even ND waits until price has moved a certain number of ticks in her direction first.
I - So price only makes it this far, still below the SL, and less than 2 points above my entry. Based on this, another entry could be made below this bar, but the stop would essentially be much worse now. (What this teaches me is not to exit just based on price moving against me. It hasn't gone above my signal bar, nor has it gone above the SL)
After this, its just down.
J - Going through the OL where the double bottom happened provides a bit of a pause, and a great RET to short.
K - This seems like a significant RET, although its only 6 points really, and there has to be a higher low and hopefully a higher high as well. Trailing another short below these bars would also work. I am trying to see this in the charts now and drill it into me that just because price has moved back from an ultimate low, I need to wait to see a higher low first before even starting to think of an exit. The straight "V" type of reversal without a higher low happens rarely.
L & M - Here we do in fact have a higher low and higher high, but its all too close together, doesn't look quite right. This would be micro managing like I do with those little trendlines I used to draw.
N - In real time, price just dropped like a rock here, 10 points in only seconds!
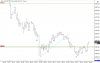
P - If we try and trail another short here, this would fail, but after 30 points down, am I still going to try to short each RET? Plus, this drop was rather climactic, so lets expect to at least retrace the drop down, even if it won't be the start of a reversal back up.
Q - This ends up being a higher low, so a long entry above could be made. Its tricky because in such a strong down move, the last thing you want to do is go long, but given the climactic nature of the drop, this is higher probability I would say, and it does work. Price does go against the trade about 2 points mind you, and breaks the low of the signal bar by a tick, so depending on what the plan would be, this trade might have been stopped out for a loss.
Lets also see what would happen if we draw a DL connecting these two swing lows.
R - Now would I be inclined to short here? We are somewhat in an uptrend now, but the trend down is so strong. It just so happens that a short here would fill, and some people must have shorted, but its quickly rejected.
S - The DL would break here, but there isn't a RET to short anywhere. What interesting is that shorting below any of the bars slightly higher up would have worked. So in such a strong down trend, shorting below these RETs does often work until we really test the low again.
T - First RET happens above here, but this is right in the middle of the congestion area to the left, and right at the important level of 3998.
U - Coming down to test the previous low... it holds.
V - And sure enough, lots of traders are excited to buy above the bars below since price makes a quick dash up.
W - Could we almost call this little drop down to W a test of the breakout level of that little 4 minute consolidation area? I guess we will know if price keeps going higher.
A few mins later, price goes lower by only 1 tick but it essentially holds and really takes off from here. Calling bottoms is hard though.
SUMMARY
Well, what a great day. I do very much feel like I'm missing out because the trades today were very well thought out and according to the roughly sketched plan. I could be up well over $1000 in just these past two days by only taking one trade at the open once price bounced off the 5 min SL. I guess I can't dwell on what could have happened. If my trading plan does actually work, opportunities will always come up. (sure would be nice to have some solid days after a 4 month losing streak though!

)
")