Who exactly is supplying and demanding at these micro-levels? HFT algos trying to capture a tick or two? Leave that game to them and focus on levels that have enough meaning to enough players that there's a chance to scalp 5 or 10 or even 20 NQ points.
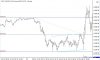
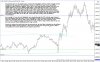
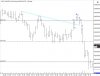
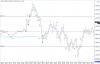
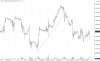
Yes, I'm a day trader and yes, I'm a scalper, but if I were to use a 1-min chart to draw these micro trend lines and try to trade off them, I'd have no way to attain positive expectancy (necessary for eventual profitability). On slide 3, you've drawn a demand line across the lows of a couple of consecutive 1-min bars. There's nothing there but a couple of 1-min price bars.
Now compare this micro-management style of trading to a slightly bigger picture style of trading:
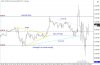
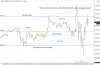
Five minutes prior to the market open, connect the swing highs and lows of the overnight session leading into the open such that you define a trend or, if there's no clear trend, you define a triangle or range (whichever applies). Since I saw a wide range around overnight lows with very slightly higher lows and very slightly higher highs, I connected the lows from 5:35 and 8:30 eastern time, and the highs from 2:00 and 9:00am (the 9:00am high was the parallel upper channel line of this slightly uptilting wide range). These upper and lower lines formed a wide symmetrical triangle. I can then watch the price action surrounding the open and see which side wants it more. Leading into the open, price was coming back down from the upper channel line and would be fairly likely to test the LTL. If the bulls want it badly, 4034.00 should be well-defended.
Sure enough, it's not only well-defended, price pushes through the UTL and the upper channel line a few minutes after the open. This is a long signal IF there's a shallow pullback to the breakout zone and a close back above it. This is when I watch the 1-min chart, not a moment sooner. There's a bit of wiggle and jiggle and then the 9:37 bar provides a long invitation that fits my 5 pt max stop loss and 5 point minimum profit target criteria.
Notice also when price pulls back from the next push up, the level that's defended on the pullback is the high of that 9:37 long signal bar. You can get long again or add to your position for another measured move target around 4053.
This is what happens in a trend. This is "Trading for Dummies". This is classic 5-min/1-min price action behavior. This is stuff of which dreams are made.
HOWEVER, BEWARE! When you read this, don't just take my word for it! You see, I've been revealed to be a despicable sort who makes all this stuff up to lure newbies to their demise. So please, please, only try this at home in the safety of a simulated replay account.
Yes, I'm a day trader and yes, I'm a scalper, but if I were to use a 1-min chart to draw these micro trend lines and try to trade off them, I'd have no way to attain positive expectancy (necessary for eventual profitability). On slide 3, you've drawn a demand line across the lows of a couple of consecutive 1-min bars. There's nothing there but a couple of 1-min price bars.
Now compare this micro-management style of trading to a slightly bigger picture style of trading:
Five minutes prior to the market open, connect the swing highs and lows of the overnight session leading into the open such that you define a trend or, if there's no clear trend, you define a triangle or range (whichever applies). Since I saw a wide range around overnight lows with very slightly higher lows and very slightly higher highs, I connected the lows from 5:35 and 8:30 eastern time, and the highs from 2:00 and 9:00am (the 9:00am high was the parallel upper channel line of this slightly uptilting wide range). These upper and lower lines formed a wide symmetrical triangle. I can then watch the price action surrounding the open and see which side wants it more. Leading into the open, price was coming back down from the upper channel line and would be fairly likely to test the LTL. If the bulls want it badly, 4034.00 should be well-defended.
Sure enough, it's not only well-defended, price pushes through the UTL and the upper channel line a few minutes after the open. This is a long signal IF there's a shallow pullback to the breakout zone and a close back above it. This is when I watch the 1-min chart, not a moment sooner. There's a bit of wiggle and jiggle and then the 9:37 bar provides a long invitation that fits my 5 pt max stop loss and 5 point minimum profit target criteria.
Notice also when price pulls back from the next push up, the level that's defended on the pullback is the high of that 9:37 long signal bar. You can get long again or add to your position for another measured move target around 4053.
This is what happens in a trend. This is "Trading for Dummies". This is classic 5-min/1-min price action behavior. This is stuff of which dreams are made.
HOWEVER, BEWARE! When you read this, don't just take my word for it! You see, I've been revealed to be a despicable sort who makes all this stuff up to lure newbies to their demise. So please, please, only try this at home in the safety of a simulated replay account.