Trading NQ via Price Action

KP.... You are making progress.... I highlighted some things that you wrote that can be important.

I need a trading plan/I clearly need a trading plan (this is really important)
firms rules about getting in and getting out. (without this, you really don't know what to do)
And yet I feel that no matter how detailed it is, the weakest link will be that person and I hardly doubt the person who found it could implement it as well as the trader who wrote it. (you can either start one from scratch or start with what you have gathered from someone else and make it your own... but you must change it enough to make it your own )

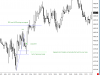
I'm sweating too much trading the one minute bars ... I think I will look into using a 5 minute chart. (yep... either try 5 min chart or choose 2-3 min bars first to see if that helps eliminate some of the noise you are encountering... you would be surprised at the difference between 1min and 2-3 min bars... noise can really mess with your mind when you are just starting out)
It does also allow for more practice (1 min bars do allow for more practice, but they also generate a great deal of noise that can screw up a good trading plan... 2-3 min bars would reduce some of the 1 min noise and still allow more practice than the 5 min bars, depending on what your trading plan is... this is your call as to what makes you more comfortable... i started with 1 min stock charts and had the same noise problem... tried 2min and it helped, ended up using 3 min charts when i traded stocks..... then when i switched to futures, i switched to tick charts... tick charts made me feel good :) )

The slightly larger time frame will allow for some of the "noise" to be equalized,
I am worried about the larger stops (depends on your trading plan... there will be a certain amount of noise that is inherent in the symbol that you trade. The stoploss has to account for the noise as well as what you want to do.... if the stoploss is too small the price action noise will kill your stops so it has to be a certain minimum for the symbol and also has to accomodate your trading plan.
)

Hopefully this higher time frame chart still allows for several trades a day... (maybe, but it will depend on your trading plan...)

toucan
[/quote]

Hi Toucan... thanks for pointing these things out. I gotta ask you though... tick charts for futures?? LOL... Are you just scalping perhaps?

Its great that you picked up on my need for a trading plan... I feel it to my core, and of course you have said this to me in the past and yet I didn't do anything at the time.

The next post about what's in yours though is so detailed actually. How do you actually define all of these things? I mean its one thing to say look at pace, but its difficult to put it into a rule that you can check off one by one if the trade meets certain criteria. Perhaps I see this as being automatic once you have been doing this for years, but its seems far too complex for me. I think the less decisions I have to make the better. Kind of like when I saw looking at my reversal trades off overnight levels. Basically I thought to just enter an automatic trade when price is withing 2 ticks of a point, exit is at 1 or 1.5 points beyond the level. So the trade is entered and if it triggers its just a matter of waiting to see if it takes off or gets stopped out.

Of course I saw that when this works it works really well, but not always. So then I thought I can just use the tick chart to guide me a bit so that the order isn't automatic, but place after seeing at least a tiny rejection and retracement in the tick chart. I didn't finish with it as I found it often didn't work enough, but the rules would have been simple and if I saw that it worked well over 25 instances as an example, I could start trading it.

This is what I think I need to come up with, something solid and easy with firm rules that say get in here, watch, and get out here. Rinse and repeat!
 
Why are you still trading with real $$ when you have no plan to follow? I made the suggestion that you switch to sim only roughly $1k in losses ago.

You cannot and will not learn to consistently profitably trade when you keep changing methods/ideas/timeframes/etc in a live environment. You already know what your problem is: you have no confidence to take trades and stick with them because you haven't done the hard work of developing a concrete plan/system and backtesting it. Do you *really* believe this is something you can accomplish real time in a live environment with your fear/greed emotions getting in the way?

Well.. to be honest, yes, I actually thought I could. I thought I could just take a few trades, make a few points and stay out of trouble as I learned.

I didn't take the suggestion because I'm stubborn, because my platform doesn't allow me to sim, and because I was scared that I'd be missing out on making some good money back on a day when the trade just took off, which the NQ sometimes does for 30 or 40 points, and then I could just buy additional contracts on each retracement so that by the end of the say, I could more than easily make $1000 to cover some of the losses.

So there you have it... my stupidity for the world to see! :) I just cannot believe that given the chart at the end of the day, how I couldn't see that its going up, so just buy and wait. I thought that by trying out different things I would hit one that worked really well as I thought I just needed minor tweaks. I thought that if I kept trying that I could get over my fears by holding just a bit longer. I wanted to work through the emotions, but deep down inside I knew that I didn't know if any trade was particularly good, but I wanted to see what would happen once I put my money in because I figured the best way to learn is by doing.

The good thing is that I'm by no means broke, I'm not discouraged enough to stop (just a little bit that I didn't have beginner's luck, which is a good thing), and the reward is more than worth continued perseverance. I just hope I'm closer to the finish line than the starting line.

And yes, you're absolutely right with everything you say, and my answers are unfortunately as truthful as they can be as well, so hopefully someone learns from all this.
 
These are my thoughts for a long:
  • Previous demonstration of (some) strength (swing high is longer and quicker than the previous swing low)
  • Test of the previous break
  • Trapped short traders how have shorted into resistance after a HH (i.e. this is a rubbish place to go short)
  • PDH and HOD providing a magnet (and target)
 

Attachments

  • 18-09-2014 21-25-29.png
    18-09-2014 21-25-29.png
    27.6 KB · Views: 113
I'd suggest replaying the day using SLA mechanically exactly as DB wrote it and then compare even that to what you are doing now and see what happens. While in replay pause it take notes and think what do I need to see to exit? What do I need to see to hold on? Where are we in relation to context etc etc? After a line breaks or a swing breaks again pause take notes and think. It's almost like being in the observation phase with a trade on and the ability to slow everything down. This helped me immensely in terms of controlling emotions.

For example if I was in a trade and saw what I would classify as "strong pressure" opposing my entry I would pause the replay and just start asking questions. What just happened? How far, how long, how fast did price just move opposite my entry? Where the heck are we? Without the ability to pause in real time that's when, for me, seeing certain behaviors I would freak out lol. Obviously in real time you can't pause and make a decision but I found doing so in "lab" has helped me create more of a structure, understand what behaviors are a cause for concern or not and answer some of the questions/detail SLA leaves out...what's a line break etc? I still have some more work to do before forward testing. Probably another week or so before that but I am confident that there will be nothing but improvement in what I have previously done before.
 
[SIZE=14px said:
I hate the idea of "setups" and patterns and I so much like how Db teaches trading behavior, but I went wrong somewhere.
[/SIZE]
  • Al Brooks and Bod Voleman books are full of behaviour
  • Db's SLA entries are based on the break of bar highs and lows. So it's ok to use bars for entries?
  • I think ND created her trading plan using Voleman's setups
  • DB has stated that the lines used in SLA are just training wheels
  • There is no behaviour in SLA
  • SLA has an ambiguity at its core - how tight to draw the lines
 
Last edited:
Anyway, if you're reading ND and you wouldn't mind sharing more about your plan I'd love to read it, perhaps just as a rough template because I find it interesting that you say its simple yet when you talk about price action you have an incredible library of filters in your head. (whatever you feel is appropriate over a forum or even a PM would be great) I guess I'm just curious about what you look for in a 5 minute chart, and how you identify your levels of S/R that seem key to your trading.

Toucan's post is really similar to what I planned to post for you. (Interestingly, I also settled on 3-min charts when trading stocks, but use the 5-min/1-min combo for futures.)

First of all, drawing micro-trendlines on a 1-min chart will cause your head to spin IMHO. I draw the lines on the 5-min chart and use the 1-min chart to target entries allowing me to get in without having to use wide stops. Al Brooks talks about how overshoots of micro-trendlines on 1-min charts during a trending move are perfect with-trend entry signals. I used to think they were the start of reversal and once I learned to do the opposite of what felt right, I started ringing the cash register like crazy during trends.

Take a look at your early short entry, break of the minor trend line, and compare it to the step-by-step illustration I posted last spring for the breakout pullback entry (BOPB). So the minor trend line (the thicker blue line on your chart) breaks and you wait for price to pull back to it and as long as price doesn't close back inside it, place a sell stop 1 tick below the qualifying pullback bar. Using this simple "confirmation entry" method, your short trade is never triggered, allowing you to evaluate a possible reversal when price breaks the previous high just before bar A. So now there's a higher high, meaning you can get long if price finds support at a higher low. Where is a likely price for higher support to be established? Take a look at the high of the last down bar leading into the low (one bar before D). When that high broke upside, it attracted scalpers to the long side and price is very likely to retrace back to that level. Why? Because a thousand hours of research showed me that's a very common price action pattern. Sure enough price finds support there and you can place a buy stop 1 tick above that bar's high for a long trade, stop loss just below that bar and a measured move target zone around 86.

I illustrated this type of trading tactic here several times last spring. It work more often than not, but you need to study the price action environments where it works best.

I'll continue with that in my next post.
 
My plan is about 60 pages with all the illustrations included, so I won’t be sharing that any time soon. I will share the stuff that’s involved in one of my strategies so you get an idea of the amount of work that went into it and how doing it this way absolutely avoids confusion in real time at the hard right edge.

This setup looks to buy or sell oil futures in the direction of a strong directional push and uses only the data from a 5-min chart. There is no need to reference trend lines or channel lines.

The strategy involves a setup bar and signal bar.

The criteria for a valid setup bar include:


> Position of bar relative to the 20EMA

> Range of the bar’s open/close

> Relationship between open/close and hi/lo

> Information about the bar preceding the setup bar

If all of the above fulfill the designated criteria, the setup is valid and I wait for the signal bar to close.

The criteria for a valid signal bar include:


> Range of signal bar

> Relationship between setup bar hi (or lo) and signal bar hi (or lo)

> Nature of signal bar (bullish, bearish, doji)

> Relationship between signal bar lo (or hi) and setup bar mid-range

If the signal bar is valid, I place an order. If the order isn’t filled during 5-min bar following the close of the signal bar, the order’s cancelled. If the order is filled, a stop loss and profit target order is placed. If price runs 60% of the way from entry to target, the stop loss is moved to break even.

All these criteria and actions are based on statistical analyses of more than 100 appearances of the setup.

This is the sort of study that, if done for a strong setup like the breakout pullback hook, will help you develop a method using SLA PA tactics that offers many opportunities each day.
 
I'd suggest replaying the day using SLA mechanically exactly as DB wrote it and then compare even that to what you are doing now and see what happens. While in replay pause it take notes and think what do I need to see to exit? What do I need to see to hold on? Where are we in relation to context etc etc? After a line breaks or a swing breaks again pause take notes and think. It's almost like being in the observation phase with a trade on and the ability to slow everything down. This helped me immensely in terms of controlling emotions.

This is pretty much how I developed my plan. I didn't have replay, but I scrolled back to the start of each day and revealed a bar at a time, taking notes for all sorts of variables and conditions. This was very helpful eventually in convincing me of certain basic concepts that made the difference between profitability and net losses despite perfect entries. For example, I learned that I can't move a stop to break even until price has gone at least N ticks in my favor, otherwise I cut most of my winners while letting my losers run. I also learned that just because price comes within one tick of my stop loss doesn't mean the trade is no longer valid. It means that the stop loss was placed properly and unless something else changes, the trade is fine. The validity of the trade doesn't change just because I felt certain my stop was going to be hit. (In fact, one of my trades today came within 1 tick of my stop and ended up gong all the way to my nearly 40-tick target; it would've been a shame if I let an acceptable adverse excursion cause me to change my mind about the trade.)

The post by eminiman above describes how I developed my plan, and that sort of work helps develop a proper mindset.
 
ND.... your above 2 posts are spot on.... this thread is getting good...

great job

toucan


My plan is about 60 pages with all the illustrations included, so I won’t be sharing that any time soon. I will share the stuff that’s involved in one of my strategies so you get an idea of the amount of work that went into it and how doing it this way absolutely avoids confusion in real time at the hard right edge.

This setup looks to buy or sell oil futures in the direction of a strong directional push and uses only the data from a 5-min chart. There is no need to reference trend lines or channel lines.

The strategy involves a setup bar and signal bar.

The criteria for a valid setup bar include:


> Position of bar relative to the 20EMA

> Range of the bar’s open/close

> Relationship between open/close and hi/lo

> Information about the bar preceding the setup bar

If all of the above fulfill the designated criteria, the setup is valid and I wait for the signal bar to close.

The criteria for a valid signal bar include:


> Range of signal bar

> Relationship between setup bar hi (or lo) and signal bar hi (or lo)

> Nature of signal bar (bullish, bearish, doji)

> Relationship between signal bar lo (or hi) and setup bar mid-range

If the signal bar is valid, I place an order. If the order isn’t filled during 5-min bar following the close of the signal bar, the order’s cancelled. If the order is filled, a stop loss and profit target order is placed. If price runs 60% of the way from entry to target, the stop loss is moved to break even.

All these criteria and actions are based on statistical analyses of more than 100 appearances of the setup.

This is the sort of study that, if done for a strong setup like the breakout pullback hook, will help you develop a method using SLA PA tactics that offers many opportunities each day.
 
Back
Top