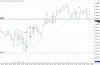
O - Shortly after the open, I can draw in a DL for the first few minutes after we reject going down.
A - This tight line gets broken, and I entered a short here at 77 but it didn't fill and price went past me. No problem as on the next bar we go higher.
B - By about this point I start to draw my hinge in.
C - I see this exit and go short. Feeling good about being 2 points ahead, but then price starts coming back up. The last thing I wanted to do was take a quick profit so I held on... waiting at least for where the apex would be. (its funny how quickly things go from not wanting to take a quick profit, to having to get out so that you can keep the loss small)
D - And here is where I had my stop loss. I dragged it far away so that it wouldn't accidentally be hit, and yet there was so much strength in this up move that it got hit in no time. I knew at least 2 point below that this doesn't look good but I kept hanging on.
Lost 4 points here so at -$84.
E - So no problem, lets try and go long here above this bar below. The entry is 2 ticks higher than what I would like, but oh well.
As you can see, the exit is 2 bars later. The DL broke, and I better not hang on too long. It turns out that I could have exited for BE, and price eventually went higher, but I think I've been saying before that holding losses is no good, just like my first one today.
F - I try my last trade here, a short based on the quick rejection of the PDH and we are also at the OH. I took this trade after price came back down from the high. We go sideways for 4 minutes which seems incredibly long. It was barely a 2 tick trading range. I had a tight stop just above these levels and sure enough, when price broke through, it did it with force.
So I'm now at -$152.
Now I'm fully seeing the general up trend here, but I just thought that a REV trade at these two levels was a good place to take a trade. At least the stop is kept tight.
Its a shame really because after my first short failed after that hinge, which first broke out the bottom but then reversed direction and went up quick, is a huge sign of strength. I have been caught in this exact same thing before. And just like before, I don't exit right away, I hold onto hope, and worse than taking a bigger loss than I should is not quickly taking the opposite trade given the show of strength.
SUMMARY
Its funny because I hadn't really intended on taking a trade today. After the past few days I think its finally gotten through that I need a trading plan. On top of this, I can see that I'm sweating too much trading the one minute bars. I wanted to be able to trade this chart, thinking that I could make a few points here and there and once I'm consistent just load up on contracts, but this clearly isn't the result.
So I was already very much looking into the higher time chart, especially after the conversations with ND. Db also of course trades a much higher time frame chart... just a few days ago he said that he doesn't day trade. It surprised me a bit given all the info in the SLA threads, but I do remember him saying that he did this only because this was the chart that most people wanted to use. It does also allow for more practice I think because waiting for hourly bars to close can take a while!
")
Anyway, so I'm done for today, and done for now. I fear that I am going to miss out on a big trend day later today or tomorrow and just by sheer luck I would get into a move and collect 20 points but I might lose far more than this before this lucky day comes up.
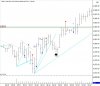
G - So price climbed higher and held up to this DL quite well on this first bounce to the left but then broke below. This might end up being the perfect 123 setup and likewise the SLA setup, but I'm too nervous to get into anything now.
H - Well we in fact made a higher high, so I guess this trade is off the table.
I'm down just under $3000 since I started, so this isn't too bad, but what's worse is that I'm back at the beginning.
These 123 setups and even SLA need more qualifiers/filters, and this now adds so much more complexity.
I think I will look into using a 5 minute chart. The slightly larger time frame will allow for some of the "noise" to be equalized, and although I am worried about the larger stops, a string of 2 and 3 point losses with trading the one minute charts adds up to a big loss anyway.
Its interesting to read ND write that her plan is simple now but that it took her a long time to get there. I've seen so much of what doesn't work for me that I'm not sure of how to move forward. (ie. what's important to look at?)
In the back of my head is also the feeling that perhaps I didn't do too badly. Perhaps the reason why I got to here in terms of a money loss is that I didn't cut my losses short, and when I took profits it was sometimes just ticks because I wanted out of the trade, even though I had gotten into great 20 point moves right at the beginning so all I had to do was leave those trades alone. I clearly need a trading plan, but maybe just some slight tweaks to what I was already looking at is all that is needed with firms rules about getting in and getting out.
Anyway, if you're reading ND and you wouldn't mind sharing more about your plan I'd love to read it, perhaps just as a rough template because I find it interesting that you say its simple yet when you talk about price action you have an incredible library of filters in your head. (whatever you feel is appropriate over a forum or even a PM would be great) I guess I'm just curious about what you look for in a 5 minute chart, and how you identify your levels of S/R that seem key to your trading.
I understand the SLA quite well as an example, but then given that the trader has to choose an exit, be it a slight break or a solid break of a line, and given that these lines are a bit dependent on the swing points you use in real time and how tight you make these lines, this does introduce variables that make it a bit difficult to follow. I guess the trick is to make it your own.
Its funny because the trading plan is presented as being something so solid that if anyone found it, it would contain enough information to allow that person to trade it. And yet I feel that no matter how detailed it is, the weakest link will be that person and I hardly doubt the person who found it could implement it as well as the trader who wrote it. I hope I'm not just trying to justify in my head of why I couldn't make SLA work for me and hence laying the blame elsewhere. I just see that in real time I had to make decisions that I wasn't prepared for.
Anyway, given the book that ND suggested I read which is excellent and should finish by the weekend, I am hardly giving up. At the core of what Db teaches is the importance of the trading plan, and this is perhaps my biggest downfall. The fears I have can more than likely be alleviated by knowing that I have a statistical advantage when the trading plan is well defined.
I'm not exactly sure how to go forward with it, but a start will be looking at the 5 minute charts and instances of the 123 setup along with SLA. Hopefully this higher time frame chart still allows for several trades a day (although only one good one would be plenty) with a positive expectancy if I go back for just the past few trading days this week. Exits out of hinges will be looked at along with exits from trading ranges. Trends after all start somewhere, so the market is either just trending or in a trading range. I will keep it easy in terms of "does this work or doesn't this work", along with "if this doesn't work, does the opposite trade work instead." Today the exit of that hinge, when it didn't take off down could have been exited for a 2 or 3 point loss and if the long had been taken right away, this could have been an almost 10 point trade.
So with ND saying she uses 5 minute charts, and with Db saying I'm missing the macro, and knowing that each tick against me freaks me out anyway, I'm hoping the higher time frame will allow me to see things more clearly.
")