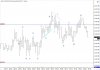
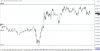
A - Seeing this resistance to get above 4007 is really catching my eye here. It is a few ticks below the overnight high thus far, but to even see how the overnight high formed gave me some confidence in thinking that the LOLR was down because the price went sideways for so long in the previous hour that formed the overnight high.
More importantly for me though, I know that if I take my short here, I know that my stop would be just on the other side of the OH, so a 2 point stop would be plenty to see that the short isn't going to work.
B - Coming up to here, same thing... we can't cross 4007. Now of course if I took my short at A, I would be nervous as price came up again, and if I moved my stop to BE, I'd be essentially out just before price goes down again, but hopefully I wouldn't be that paranoid and would keep my stop where it was originally.
C - This little thrust up goes even a tick higher, but its a quick REJ. So now of course I'm kicking myself for really not taking that short, but oh well, the trade is gone, and the open is soon.
O - The open happens at pretty much where the DL gets broken. I take note now of major DLs. Not only are they pretty much the same on a 5 minute chart since the major swing points on a 1 minute chart also show up on a 5 minute chart, but I see how by the end of the day, its these major lines that work the best. I'm of course using this as confirmation to add to my short bias.
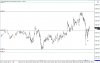
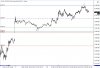
D - Anyway, so although we go down, back up we come. A couple of weeks ago, I would have been shorting right at the bottom thinking we just rejected the opening level, but thankfully, I now know that rejections have to be based on rejections of something else, and the opening level isn't rejected yet until price comes up again and turns around here.
So coming up to "D", I notice how price is rolling over a bit, and 2 or 3 bars later, the DL would be broken if one was drawn in just below the lows of these bars that come up. This might now form a lower high, and although it would be hard to catch a short at the tops of the two bars to the right at 4006, we are still fairly close to 4008, above which would be a stop as before to invalidate the short.
E - Before "E", where we formed the swing low and came back up, I started to draw in this hinge. These pokes here at E suggest going higher, but none of these bars close above the hinge. I think I picked this up from NoDoji, the idea that price breaks something you have drawn in but doesn't close above the break. I know its not correct to talk about bars closing and opening since price is continuous, but what this shows is the behavior actually, the inability of traders to keep price above this hinge given that in the same minute that price did go higher, it couldn't stay up there and came back down.
Since Db also says that hinges tend to first exit in the opposite direction, I'm looking at this poke above now as further confirmation that we are going to go lower.
There was an excellent discussion last year about hinge activity when Db was actively posting in his threads, same time that fortydraws was also posting so it was a discussion between them, and it was a nicely laid out thought process as the hinge was forming. If anyone wants the link I can look it up, but its because of all of these great posts from the past that I am trying to focus on looking at things in a similar fashion.
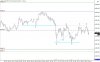
F - So here we drop out below. Now of course the trade was really higher up, and I'd say that if I had confidence in my hinge ability, seeing the poke up and rejection of the exit out the top would be an excellent reason to take a short, so now this poke out the bottom should be of no concern because my short would already be in the money and I could watch it more casually without fear. But now I have to wonder if the poke before is a good reason to short, and then of course wonder where to short and where my stop would be. If the stop would be at the apex of the hinge, its too many points away, so perhaps I could only get in on a RET on the tick chart below the hinge and have the stop at the exit level of the hinge.
G - Price seems to turn around just above the mean I have outlined. The little double bottom of the two bars isn't really at any special place, but here at "G" I do bring forward the previous swing low from overnight. Its tough to say if price turns around because of the mean, or the swing low, of perhaps because 4000 is such a lovely number that traders paused at before, but price does go back into the hinge and goes up quite strongly.
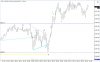
H - Coming to H now I'm thinking if I should even consider a short. The move up is strong, so a reversal here would be putting the full breaks on real quick to go into reverse. On the tick chart, I don't even think an opportunity came up to even consider a short.
The sad part of course is that since this is a fairly prominent level, what I would call an extreme given how it provided resistance for quite a while, I know that taking a short or long is a solid trade, so if the short is out of the question, the long should be strongly considered because once we cross this level of resistance, going up should the LOLR.
I - I mark in what would be an SLA long. What's nice about this is that its a long at an extreme level, not in the middle of nowhere, and when the fill would happen two bars later, you can even see a little test down of the 4007.75 level and price bouncing off, so the long looks quite solid.
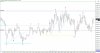
J - The long didn't go far, but on the way down we stop here. Certainly taking profits higher up would be prudent before even seeing how low this goes. I just noticed now that this trek down to J is way above the 50% if we consider this most recent move as being from 4000 to 4013, and if RETs are less than 50% of the preceding move, the move is considered strong.
We do go a bit sideways after this, and I'm getting tired. Clearly I'm not ready yet to put on more trades so its time to pack up.
SUMMARY
Based on my analysis, which was mostly done in real time, I think today would have ended up to be quite a good day. I had lots of confidence in the short below 4007, and after we came back into the hinge above F, I wasn't in any way married to my short that I couldn't have seen price going up. Waiting at H to see what would happen was also solid, and even if I did take a short there, I knew clearly where my exit was. Trading at the extremes I really like because exits are well defined. I don't have to hold through a 3 or 4 point stop because some random swing point that I want to use as a stop is so far away.
So as it stands right now, after doing so much studying, I am trying to dial in the criteria I will use for when I will take trades based on behavior, such as around the hinge action, since this doesn't happens at an extreme level, and when I will take trades such as at A B or C simply because they happen at a top. Trading at the extremes in my head is much better defined, which I like, but if I learn to read behavior well, this too will provide lots of opportunity, and give me something to do if the original trade is gone or we are nowhere close to extreme levels that I have outlined. (And if PDHs and PDLs aren't really good enough extremes levels, then I need more to go on)
As I'm finishing up, we are really having trouble going above 4013, and its been sideways for almost an hour now so I'm not losing out on much right now. But after I left to take a nap yesterday, we did have a 40 point drop... so who knows what's in store!
")