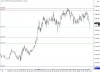
So when you look at the attached chart, the red level at 3983 was already on my chart and it clearly is causing major hesitation. There is one slight poke of 2 ticks, but reversals when we got to within 2 ticks would have been profitable. My does keep rebounding less and less though. I'm incliced to put a level of support at 78.75, mostly because of that firm rejection of that one bar, but it could also be as low as 77.50.
At any rate, we have this range now of roughly 78 to 83 that we need to clear. There is another level at 91, not too far away. It hurts to look at the hourly chart as its pretty much just straight up, so all this work seems alomst pointless if I just took a long term approach.
I did hit a bit of a snag. I was reading over old material, especially quotes from Db, and he outlined that using PDH or PDL isn't really all that predicive, or something like this. Basically, these don't seem to be extreme points. It is true that a PDH is only one instance of price turing around, and for a level of resisitance, you'd want to have multiple instances of price not being able to penetrate, but on my charts, I do see that price either reverses here, or goes successfully through. Perhaps this isn't often enough though to base a trading plan around.
Going through the material, there were excellent discussions last July to Sept, the focus really is on areas beyong which trades cannot find trades. And as Db has always said, looking at rejections is vital.
So I'm not wrong with my approach, and focusing at these extreme levels is exactly how this has to be done, and I know what to do when we get there, but I think I'm gonna need to work hard to identify these levels.
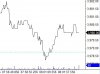
Today we have an overnight high at 83.50, and that level at 83, and the congestion here is obvious, so we should either break through or reverse down. This being a top from almost a month ago, its obvious lots of eyes are on this level.
Just recently, price reversed from 82.75 and is coming down... shoot.. have I missed the trade already???