Here is the tick chart of that trade actually. Had I known that I have a level at 86, I would have gotten out much sooner, but I kept thinking this is just a deep RET/recoil and it will turn back down on its way to the previous day low. Of course the entry is stupid so any justification is pretty much useless.
You are using an out of date browser. It may not display this or other websites correctly.
You should upgrade or use an alternative browser.
You should upgrade or use an alternative browser.
Trading NQ via Price Action
- Thread starter k p
- Start date
We can't win every trade. You had some good ideas today. Its a pity we didn't make it up to the highs. There could have been a good trade up there.
Yes, you can't win every trade for sure, but there is no place for stupid trades. I haven't gotten a chance yet to go over the trades of the past few weeks and catalog which were actually legit and which were random based on missing out (I feel its more important to spend time right now on moving forward), but I am almost certain that my losses up to now are the result of these stupid trades. If I only made one change, which was to not take a random trade after price dropping many points without me, I think my account would be down less than half of what it is.
The good thing is that I see it, and I have a very clear idea of the types of trades I want to take from now on. I almost feel like starting my journal again and calling it Trading NQ 2.0 to reflect the huge awakening! I want to give myself a new name as well... something cool like extreme-trader, short for ET... get it... LOL...how cute is that???, but also to reflect that I will only be trading at the extremes!
One minor update. Looking at my charts, I see that where I mentioned an SLA long at U is in fact not correct. I am assuming I am looking for a long here because of the bounce at the overnight low, but if I had in fact drawn in a SL from the top at 3914, it wouldn't be broken, so no way should a long at U be considered an SLA trade. In fact, price follows a SL down quite nicely until it breaks around 3891. The two times that price slightly penetrates the line, price comes back down. If the SL is fanned slightly at the high just above U, then price touches it again nicely around the opening low and price respects it and comes back down.
Didn't you vow to stop trading and develop a trading plan as recently as a few days ago? Yet today you were trading again. Have you taken any days "off" from trading? If you feel you *must* trade, switch to sim so that mistakes don't cost you any real $$, or perhaps more importantly, mental capital. The trick of course will be to attempt to trade sim just as though it were real money. You will find it much easier to be disciplined on sim.
Regardless, I do admire your willingness to document and admit to your mistakes - that takes guts
Regardless, I do admire your willingness to document and admit to your mistakes - that takes guts
Didn't you vow to stop trading and develop a trading plan as recently as a few days ago? Yet today you were trading again. Have you taken any days "off" from trading? If you feel you *must* trade, switch to sim so that mistakes don't cost you any real $$, or perhaps more importantly, mental capital. The trick of course will be to attempt to trade sim just as though it were real money. You will find it much easier to be disciplined on sim.
Regardless, I do admire your willingness to document and admit to your mistakes - that takes guts
Thanks for the kind words, and you are absolutely right. In the past few days, I have actually put the bare bones of the plan together. Going through my 2 months of charts (these do take a bit of time to prepare and print), these extremes offer opportunity almost every single day. Today I was almost trying to put it into practice. Its true that I don't have entries worked out to the tick, but I thought I would give it a shot anyway. It was just the last trade that actually caused the loss today, and sadly this trade was not according to plan, so I can't be all too surprised.
I haven't been able to get sim to work with my platform, and I feel as though if going through sim, I would actually do the right thing and have a much better result which wouldn't be reflective of what my real trading would be like. My loses aren't huge, and although I am down almost $2000, spread of 6 months, this is much less than some people spend on drinking or other bad habits. I would hence still put this loss into the "tuition" category and continue to try hard to break through my deficiencies. Lastly, what I do keep telling myself is that after a couple of weeks of positive trades, adding to the contracts will more than easily bring me back to BE. It is entirely true that focusing on the money is making this a much slower process, but perhaps I'm the type of person that learns more by doing, and I'm stubborn. I should know by the end of the week if I do need to fully stop or not.
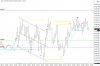
Well this is the drill... in the attached chart. Eventually I think I will need to develop more levels of solid support and resistance, but here is what I have going into today just using the previous day highs and lows and overnight highs and lows.
The PDH has been breached, so it doesn't look to be of much use today, but there is a nice almost double top at 3925 from overnight so lets see what happens if price rallies up to there again.
The PDH has been breached, so it doesn't look to be of much use today, but there is a nice almost double top at 3925 from overnight so lets see what happens if price rallies up to there again.
Attachments
Aye, not the best result again today. It started off ok, but I got sucked into things I shouldn't be doing.
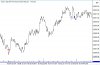
O - At the open we break a SL that we could draw from the attempt to rally to the overnight high a couple of hours before the open.
A - I see we break the overnight high, but didn't see any trade set up, long or short, on the tick chart.
B - This move does run out of steam and I enter a short here at 3924. I would have liked to get in closer to 25.25, but oh well. On that attached tick chart, I was quick to make my exit you can see, following a SL I could draw across the tops of where the entry is, and then once price swung up going through it, I made my exit. I do think if I focus on trading at the extremes, and get out right away when the trade isn't doing what I think it will do, I might survive long enough to become profitable!
So I'm out for only 2 ticks loss, and sit at -$14. Its a shame because price only went up two more ticks before coming back down. Had I gotten in sooner, I might have held and then gotten out lower for a tiny profit. I should have used the actual level as my exit, it would have only been a loss of 1.25 points, but oh well.
C - This is a fairly prominent REJ bar, so lets mark the low as we might be able to use it later.
D - We climb up to here, and I would say the level at 25.25 doesn't have as much significance now since it was breached. But this level here where price turns is an obvious lower high from A, and it even forms a double top. Sets up another nice move down of 5 points.
E - A couple of levels of support seem to form here, and each bounce forms a subsequent lower high, so to me this means the LOLR is down if we can break through.
F - We have that break and I enter a short. It is also below the opening price level so I think this looks good. But as you can see, trade doesn't work at all. The unfortunate thing is that if I consider the support level as my exit, which is at 20, I entered 1.75 points below, so I have to take a bigger loss than I would like, which is what I had to do. It seems silly to me to be entering so low below the level now that I look at it. What is more silly though is that I am taking these trades that are not at the extreme levels as outlined in prep but rather just swing points and minor rejections.
I should also mention that now in review, I see the previous day high at 17.25 just below where I enter my short, but since this level was breached overnight, I don't consider it all that important.
So now I'm at roughly -$51 I think it was.
G - A little bounce at the overnight high, but once again, this isn't significant enough for me.
H - Here I see we break above the previous high of A, I see a RET on the tick chart, and I take a long. I'm buying at the top, and my exit is at the bottom. Just terrible. If I stuck to the idea I had on my first trade where I take a quick loss when the trade doesn't do what I expect, I would obviously be down far less.
So now I'm at -$117.
I - Nice level of support here, but you know what, these are all in the middle of nowhere.
SUMMARY
So my first trade I'm happy with, and I can see how if I fine tune it, I can make it work, espeically if I get in on a trade even closer to the level.
M 2nd and 3rd trade had the right idea I think, but they are in the middle of nowhere.
The 2nd one, selling below that support level at E seemed like a good idea, but the entry is far too low. Had the entry been 2 ticks below, an exit for BE is possible, or even a couple of ticks profit.
The long at H, same thing in that it is 1.25 points above the swing high, so although I feel as if its safer because I have confirmation of buying above the RET, both trades I put on just a little too late perhaps.
Attachments
Got up early today but not much happened around the news release.
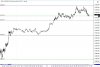
Honestly, now that I am watching so closely these firm levels, things are looking a little more clear. Overnight, we bounced off below yesterday's high for the first time below 48. Second time we went a tick higher, but bounced off again. I saw this before going to bed last night after coming home from work, and would have had lots of confidence in that short. Would have been good for at least 6 points or so.
We ultimately hit a low of 39.50. The next higher low after this only made it to 41.75 before turning up and breaking those highs at 48. I have seen this often. When you're in a range, but fail to match the same low, to go down as far, this shows strength, and sure enough, on the next up move, price did go above the highs at 48 for the overnight range up to that point.
Now of course the level to really watch was 49.50, the PDH, and I would say there wasn't much action around there except just a continuation of the up move, ultimately reaching 56.25 which forms the overnight high. We did get a slight bounce at 49.50 when coming back down, and this level did provide support for another hour but once it did break, price went through quickly.
3948 is the mean of the overnight action, and hence represents 50% of the move from the bottom to the top. There was a 10 minute consolidation here, which was an hour before the open, but price dropped further down, a sign of weakness since the 50% of the up move couldn't be held.
Now some of these areas are minor, so even though it looks clear in hindsight the way I describe it, my reasons might not in fact be what is happening. But what is clear going into the open today is that we made a high of 56.25 overnight and we are well below that now. We dropped below the high of yesterday as well, and just as I type this, we are climbing up to test the mean at 48. The overnight low at 40 shows multiple instances of support, so if we do come down again, this level should provide a solid trade.
One thing I'm trying to figure out is do I put the overnight low at 3940, which is where there are multiple bounces, with the exception of one slight penetration to 39.50, or do I use this 39.50 as my low? This might make a difference for when price comes down but bounces off even before reaching this level. 2 ticks might not seem like much, but it might make me miss the trade if I'm expecting it to go a bit lower but it doesn't and turns back up around without me, not having reaching low enough since I'm watching the ultimate low and not the visually more obvious level of a support.
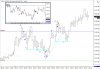
(Sorry the chart has so many lines... most of these were drawn on after price moved on forward so I could talk about what I think just happened... I do try and keep the chart as clean as possible going forward so that I can actually see price so it wouldn't look like this in real time)
A - Prior to the open, I see this level of support forming and there are already 3 bounces. Now I do want to be very careful because I know these levels in the middle of nowhere might not mean much. But this is pretty much right at the mean of the overnight range, and means mean something") , so lets just see what happens.
, so lets just see what happens.
B - We do reject this level here, getting to within 2 ticks soon after the open.
C - This gets interesting here. Its a quick drop and a break of the DL (I am keeping longer term ones on my chart now, these seem to work much better). I'm looking to see if there could be a trade here, but I'm not that eager today actually. We drop a point lower, but even on the tick chart nothing looked good and I wanted to see if it went below 46.50 since I saw this ledge forming. Ultimately we bounce off. Now I do favor reversals I think from key levels, so an automatic long at this level could have gotten a few points profit, but seeing as my account is shrinking, I need to be much smarter with my trades and not use the money for testing purposes!
Given where my opening level is (the open of the next bar is higher mind you), but this drop down to C is almost the same distance as the move up, so we could just be gyrating around the mean, which also happens to be the PDH. Maybe traders don't know if they really want to take price higher or lower than yesterday's high.
At any rate, good thing I didn't go short here.
D - We don't go above the previous high.
E - Wow, nice bounce here. If each time I had an auto order to buy at 47.50 and just watched the tick chart, I could be in the money by now!
F - After that last bounce at E, we once again fail to break the previous high at even D this time.
G - Dropping lower here, and we even have a 2 tick gap between the close of this bar and the open of the next. Its all looking quite weak.
And just as I finish writing that, price goes back up!
25 minutes in, and its looking like we have a nice down-slopping channel (outlined in red), but taking advantage of this means buying and selling at the extremes hoping for that reversals off the limits, just like in a range.
H - This is where that channel would break as we go higher.
I - Of fuck, too busy typing, and just seeing this initial bounce just below the high after the open (yellow line brought forward). Once again, this is just some random swing point, not close to how I define an extreme, so still staying out.
But man, a reversal trade here could have been worth a few points. It got to just a tick below the previous high. I wonder if once you define that the day is range bound like today, if it could be smart to just automatically take these trades expecting the reversal anywhere within a point of the level you are watching, with a stop just a point beyond it. It will eventually not work as price will break out, but I think collecting 3-5 points each time it does this is worth the loss of 2 points when it finally stops working. Lets call this an advanced move for later!
I'm feeling rich today since I'm not losing money!
J - If I was hoping for a reversal at the low here just like up above at "I", I think I would need price to come down a bit lower. Here we are 3 ticks away from the low just below G, and to see the REJ of this on the tick chart makes you lose at least another point, so going long here would actually be at least 2 points above where I thought the REV could happen, which means the stop has to be far too great because you would want to have at least a couple of ticks below the low of the bar at G as the safety net.
So since that low is 45.25, a stop at 44.25 might be appropriate, and an entry probably couldn't be made below 47 for the long since anything below this wouldn't show the up move yet, so that is way to much to risk for a trade at some random swing point. What I'm seeing is that giving price a bit of room at something major like a previous day high or low is money much better spent.
K - Same issue here. Sure looks like a double top with this previous high, but I'm more likely to watch the high at "I", so this is just a random occurrence.
Oh and look, 2 minutes later price goes through anyway... shouldn't have wasted my time drawing this in!
L - Hmmm.. is this REV gonna be juicier???
M - Here we are a tick higher than the one at "I", and on the way down we break the DL, but all of this might only be good for scalping. We are just a few points below the overnight high, that should provide a much better trade opportunity.
N - Here is my little wedge drawn in which breaks lower, but this is all just a distraction at this point now. Look.. it breaks up anyway after there was no selling just after I drew it in.
Waiting for 56.25, but I'm feeling sleepy and need to take a nap before my long day so not sure if I can hold out since we are crawling!
SUMMARY
Yup.. going to sleep. No trades today, which is good because I might have almost taken a short at C which would have been a loss. Trading the extremes of these ranges looks very juicy though... one day I'm sure!
A - Prior to the open, I see this level of support forming and there are already 3 bounces. Now I do want to be very careful because I know these levels in the middle of nowhere might not mean much. But this is pretty much right at the mean of the overnight range, and means mean something
, so lets just see what happens.B - We do reject this level here, getting to within 2 ticks soon after the open.
C - This gets interesting here. Its a quick drop and a break of the DL (I am keeping longer term ones on my chart now, these seem to work much better). I'm looking to see if there could be a trade here, but I'm not that eager today actually. We drop a point lower, but even on the tick chart nothing looked good and I wanted to see if it went below 46.50 since I saw this ledge forming. Ultimately we bounce off. Now I do favor reversals I think from key levels, so an automatic long at this level could have gotten a few points profit, but seeing as my account is shrinking, I need to be much smarter with my trades and not use the money for testing purposes!
Given where my opening level is (the open of the next bar is higher mind you), but this drop down to C is almost the same distance as the move up, so we could just be gyrating around the mean, which also happens to be the PDH. Maybe traders don't know if they really want to take price higher or lower than yesterday's high.
At any rate, good thing I didn't go short here.
D - We don't go above the previous high.
E - Wow, nice bounce here. If each time I had an auto order to buy at 47.50 and just watched the tick chart, I could be in the money by now!
F - After that last bounce at E, we once again fail to break the previous high at even D this time.
G - Dropping lower here, and we even have a 2 tick gap between the close of this bar and the open of the next. Its all looking quite weak.
And just as I finish writing that, price goes back up!
25 minutes in, and its looking like we have a nice down-slopping channel (outlined in red), but taking advantage of this means buying and selling at the extremes hoping for that reversals off the limits, just like in a range.
H - This is where that channel would break as we go higher.
I - Of fuck, too busy typing, and just seeing this initial bounce just below the high after the open (yellow line brought forward). Once again, this is just some random swing point, not close to how I define an extreme, so still staying out.
But man, a reversal trade here could have been worth a few points. It got to just a tick below the previous high. I wonder if once you define that the day is range bound like today, if it could be smart to just automatically take these trades expecting the reversal anywhere within a point of the level you are watching, with a stop just a point beyond it. It will eventually not work as price will break out, but I think collecting 3-5 points each time it does this is worth the loss of 2 points when it finally stops working. Lets call this an advanced move for later!
I'm feeling rich today since I'm not losing money!
J - If I was hoping for a reversal at the low here just like up above at "I", I think I would need price to come down a bit lower. Here we are 3 ticks away from the low just below G, and to see the REJ of this on the tick chart makes you lose at least another point, so going long here would actually be at least 2 points above where I thought the REV could happen, which means the stop has to be far too great because you would want to have at least a couple of ticks below the low of the bar at G as the safety net.
So since that low is 45.25, a stop at 44.25 might be appropriate, and an entry probably couldn't be made below 47 for the long since anything below this wouldn't show the up move yet, so that is way to much to risk for a trade at some random swing point. What I'm seeing is that giving price a bit of room at something major like a previous day high or low is money much better spent.
K - Same issue here. Sure looks like a double top with this previous high, but I'm more likely to watch the high at "I", so this is just a random occurrence.
Oh and look, 2 minutes later price goes through anyway... shouldn't have wasted my time drawing this in!
L - Hmmm.. is this REV gonna be juicier???
M - Here we are a tick higher than the one at "I", and on the way down we break the DL, but all of this might only be good for scalping. We are just a few points below the overnight high, that should provide a much better trade opportunity.
N - Here is my little wedge drawn in which breaks lower, but this is all just a distraction at this point now. Look.. it breaks up anyway after there was no selling just after I drew it in.
Waiting for 56.25, but I'm feeling sleepy and need to take a nap before my long day so not sure if I can hold out since we are crawling!
SUMMARY
Yup.. going to sleep. No trades today, which is good because I might have almost taken a short at C which would have been a loss. Trading the extremes of these ranges looks very juicy though... one day I'm sure!