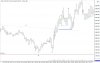
The two charts you have posted are interesting and are indeed the same function. Unfortunately you're not going to be able to work out what this is due to the decisions you've already made. You have adopted a certain mindset to look at the market which comes with certain limitations. The limitations will prevent you from gaining any understanding beyond recognising a visual similarity. Which when you recognise it will be too late to make a profit.
What function is in play here, what is the purpose, who benefits? Don't ask DB he doesn't know. Learn to ask the right questions for yourself.
Here is something which might rescue you (very long shot). Get off the Internet. Forget everything you have ever learned about trading. Doesn't exist any more. Might be wise to take a few months off from even thinking about trading. Then start over. Sit with these two charts. And think. No books. No mentors/gurus.
If you continue on your current path you're going to be here for life with all the others who are not successful. A year of getting nowhere ought to be enough to prove that to you. Unless you continue to be deluded that you've actually achieved something in this year. In which case, what is your P&L? Rhetorical.
DB says: "it was possible that [this equilibrium] might provide a launching pad either up or down at the open" - certainly this statement is true, but provides no help for a trader wishing to take a directional position and profit. It could go up or down should be recognised for what it is - a banal generality.
DB says: "trading more than one contract, real or sim, would enable the trader to keep dancing rather than become a wallflower". Two things should immediately strike the perceptive. #1 is that this is a hedge against guessing - ask any gambler - if a betting method doesn't work with level staking then it doesn't work. #2. How many successful traders trade 1 contract? Or even 2? This is the guy who you've chosen to follow and whose limitations you've chosen to accept?
DB continues with some general advice to imagine a premarket range as being an equilibrium level...and then to imagine a rubber band. So the thesis is that if price goes up X distance above the range, it is due to come back down X distance below the range. How does this help us place a trade and make a profit?
If we sell as price is rising based on some arbitrary point above an "equilibrium level"....will "work" sporadically for some arbitrary values of X but will not be +EV in itself....
If we buy as price makes the equal move back down though the bottom of the range...this will work when the function is as the charts you've posted, but will "fail" the rest of the time.
DB doesn't know why this double range break occurs or how to manage it. Therefore neither do you. So good luck trying to make a profit. Yes you have observed a condition but you are no closer to making money from it. Nor are you any closer to understanding what creates the condition as you've accepted DB's limitations. So you are lost.
If you carry on with DB you will be told to watch what traders are doing, a range will be called equilibrium, on an up bar demand overcame supply...etc. All meaningless. I know the difference between up and down, but tell me what is going to happen next: up OR down. That is trading.
Good. So you understand that nothing DB writes is of any use to somebody who wishes to buy and sell futures contracts to make a profit. It is all interesting/beautiful/whatever if that is your cup of tea, but it is not and cannot be a strategy for making net gains.
So long as you understand and are honest about this then all you have the potential to lose is your time. And it is not a loss if you find it recreational as you suggest. You just need to be happy with the end position of being able to make elegant and beautiful analysis on charts, even to "guide" other aspiring traders with your analysis, but not able to make a net profit for yourself. In fact you are not even trading as you understand that the work you've done will not enable you to make money.
For some reason I find cases like yours fascinating and morbidly horrifying and therefore I'm often tempted to waste time posting to them. It is sobering and sad to know that there is a real person on the other end who is well and truly lost without hope of redemption.
These "journal" threads encouraged by DB are truly sad. Not one person has ever come out the other side profitable. Ever. That should tell you something. But the need to believe is strong with the gullible and the greedy...lambs to the slaughter.
Baa....baa....bye...bye!
What function is in play here, what is the purpose, who benefits? Don't ask DB he doesn't know. Learn to ask the right questions for yourself.
Here is something which might rescue you (very long shot). Get off the Internet. Forget everything you have ever learned about trading. Doesn't exist any more. Might be wise to take a few months off from even thinking about trading. Then start over. Sit with these two charts. And think. No books. No mentors/gurus.
If you continue on your current path you're going to be here for life with all the others who are not successful. A year of getting nowhere ought to be enough to prove that to you. Unless you continue to be deluded that you've actually achieved something in this year. In which case, what is your P&L? Rhetorical.
DB says: "[stay] centered and observe what other traders are doing." - without knowing HOW to do this and HOW it helps you to enter and exit trades the statement is meaningless.In red, Db's contribution, the second last paragraph contains a juicy bit of analysis
DB says: "it was possible that [this equilibrium] might provide a launching pad either up or down at the open" - certainly this statement is true, but provides no help for a trader wishing to take a directional position and profit. It could go up or down should be recognised for what it is - a banal generality.
DB says: "trading more than one contract, real or sim, would enable the trader to keep dancing rather than become a wallflower". Two things should immediately strike the perceptive. #1 is that this is a hedge against guessing - ask any gambler - if a betting method doesn't work with level staking then it doesn't work. #2. How many successful traders trade 1 contract? Or even 2? This is the guy who you've chosen to follow and whose limitations you've chosen to accept?
DB continues with some general advice to imagine a premarket range as being an equilibrium level...and then to imagine a rubber band. So the thesis is that if price goes up X distance above the range, it is due to come back down X distance below the range. How does this help us place a trade and make a profit?
If we sell as price is rising based on some arbitrary point above an "equilibrium level"....will "work" sporadically for some arbitrary values of X but will not be +EV in itself....
If we buy as price makes the equal move back down though the bottom of the range...this will work when the function is as the charts you've posted, but will "fail" the rest of the time.
DB doesn't know why this double range break occurs or how to manage it. Therefore neither do you. So good luck trying to make a profit. Yes you have observed a condition but you are no closer to making money from it. Nor are you any closer to understanding what creates the condition as you've accepted DB's limitations. So you are lost.
If you carry on with DB you will be told to watch what traders are doing, a range will be called equilibrium, on an up bar demand overcame supply...etc. All meaningless. I know the difference between up and down, but tell me what is going to happen next: up OR down. That is trading.
There is an elegant beauty to this analysis that I quite enjoy. I don't know how to make use of this in real time and I don't know where my entries or stops would be. I especially don't know how to backtest behavior, but I know there is something to this.
Good. So you understand that nothing DB writes is of any use to somebody who wishes to buy and sell futures contracts to make a profit. It is all interesting/beautiful/whatever if that is your cup of tea, but it is not and cannot be a strategy for making net gains.
So long as you understand and are honest about this then all you have the potential to lose is your time. And it is not a loss if you find it recreational as you suggest. You just need to be happy with the end position of being able to make elegant and beautiful analysis on charts, even to "guide" other aspiring traders with your analysis, but not able to make a net profit for yourself. In fact you are not even trading as you understand that the work you've done will not enable you to make money.
Your continued presence here when it should now be obvious you will learn nothing of value signifies that you simply want the attention/interaction not a successful trading business. The very best thing for you to do would be to leave this site and not come back (unless of course you become profitable). Once you are profitable you are not going to be tainted or misled by certain elements here as you will be able to determine sense from nonsense very easily.Going back into hiding now.
For some reason I find cases like yours fascinating and morbidly horrifying and therefore I'm often tempted to waste time posting to them. It is sobering and sad to know that there is a real person on the other end who is well and truly lost without hope of redemption.
These "journal" threads encouraged by DB are truly sad. Not one person has ever come out the other side profitable. Ever. That should tell you something. But the need to believe is strong with the gullible and the greedy...lambs to the slaughter.
Baa....baa....bye...bye!
") ... but my point is that the blueprint of context and behavior that he provides is absolutely solid, but lacking specifics (although I fully understand the trader should be doing this work)).
... but my point is that the blueprint of context and behavior that he provides is absolutely solid, but lacking specifics (although I fully understand the trader should be doing this work)).