Ok.. so here is some analysis. Of course what I should be doing right now is making and testing a trading plan, and that is very much in the works, but let me just spit out these words.
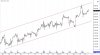
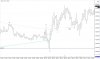
So first the 5 min chart. Yesterday was very much of a hinge, and when you draw in the lines you can see how overnight, price came to find support at what would be the apex of that hinge. This now forms our OL, and as you can see since I took this snapshot already after the open, we have a DB at this level. I was watching it intently, and saw that price only penetrated by one tick. I didn't take the trade because I don't have a trading plan worked out for this, well I do actually, in my head, but I haven't run stats. (Back when I thought I would be brilliant to just take trades at the overnight levels, I saw that it worked sometimes, and sometimes it didn't. What I never got around to was actually running the numbers on even just 50 instances of this trade.)
I think this is a very low risk trade when you drill down into a lower time frame chart, even a tick chart if you want. (I don't have tick charts anymore now that I had to switch to the different free version of MC though). But even the 15 second chart is instrumental in seeing that a buystop above a 15 sec bar that hits the OL with a stop just below this bar is a well defined trade with low risk. Its very much the type of trade that fortydraws would show, especially with the tick chart.
Everything in trading is a contradiction. Stuff on the one minute chart, although I don't want to call it noise, but much of this stuff can suck you into seeing trends that aren't there, so going with a higher time frame is always advised. But if you have your levels right, the precise entry can be a low risk trade with a high profit factor. This is one of these cases I think where the lower time frame chart is instrumental. It of course won't happen that you get a double bottom at every overnight low, but to spend less than 2 points to find out, and have that turn into a 10+ point move like today is a trade with numbers that are quite favorable.
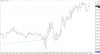
Anyway, going into the open on the one minute chart now.
A - After the open, we try up, poking through my 5 min SL, but we don't make it far.
B - If I look to the left, I can even see that we don't go above the previous high, so on the 5 minute chart, as well as here of course, we see the down trend from overnight intact.
C - So for the purposes of my mental masturbation as one member who has been e-mailing me likes to call it, lets put in a short here!
")
(Since its a slow day, let me do a quick tangent. I still maintain that what I'm doing here isn't a waste of time. The problem is that I don't know what to do about it. When I say lets try for a short here, what I should have in the back of my head are statistics that tell me if this is in fact a trade that has an edge given the context of how its setting up.
On one of my slides that I made from stuff that Db had posted about a chart in real time, he has a minute by minute running commentary, and when something significant enough happens on the chart, he would ask "what are you going to do about it". So this is thinking in real time, but the only way to know what to do about it isn't to think through it now, but to access that part of your brain that has the backtesting done for this type of event and if there is an edge from putting on a trade given the context, then you know what to do.
This for me had been how I have been able to rationalize the whole idea of backtesting and thinking in real time. I hope I'm not getting this all wrong because it allows for a way to put all of these things together so that they don't contradict.)
D - So that short was a great trade, but of course we now hit that OL as discussed above. If watching the lower time frame chart, then there is reason enough to stop and reverse, collect your small profits from the short and get into a long. Yes we are starting a down trend right now, so taking trades in the opposite direction of a trend that is establishing is risky, but once again, if you know what you're doing, nothing wrong with breaking a trading "truism" (I don't even want to call it a rule because every trend stops of course and sets up a trade in the opposite direction)
E - Now if I'm just watching the 1 minute chart, here would be my first op to go long after the DB and REJ of the OL. Is a pretty big bar given how slow today is though, so with an entry above this bar, its more than a 4 point risk. At the same time, if price comes up enough to trigger this trade, then we have sufficiently run out of sellers and the fact that we came up this high would show that buyers are eager.
F - So now here is the first RET after the DB. This is the third chance to enter now. (1st was based on a 15 second or tick chart. 2nd was above the 1 minute bar. And now here is the RET) The nice thing is that this bar is quite small which for my entry method means a small risk.
Now of course if I'm falling back on my backtesting I just finished, this RET doesn't happen above the SL, but since I'm not taking trades today live, I can absolutely mark this in as a legit trade.
G - Next RET is here, and this one is fully above the SL. If my entry criteria is 1 point above, it doesn't fill yet, but if its only 1 tick, it does fill. As for the stop, we don't have a swing low yet... we only have the low on this bar.
H - The low breaks, but it does form a swing low here. Once again though, as I said a few days ago, I'm not sure what happens first, if the fill happens first, or if hitting the low of the bar happens first. It doesn't much matter in this case because we went lower anyway.
I - So on this bar, the low breaks the low at H, so any longs might be stopped out by now. But here is the thing. The low on this bar nicely tests the SL from above, or even the break of the SL, which ever way you want to call it, so if we mark a long above this bar and price comes up to trigger, it certainly can be a legit trade. A 1:1 profit might just squeeze out depending on if I'm using 1 tick entries and stops or something more like 1 point. Its a bit more risky now I would say though given the lower low here at "I" if I'm gonna call "H" the first swing low. This might be looking too much into the micro, but it does look like the first swing low to me.
As a last note on this chart, I mark in the 50% level of this up move from the low at D to the high at 4302. We break below, but then turn back up. Sometimes these 50% levels work to the tick, other times they don't.... oh well.
SUMMARY
I really gotta laugh how when I'm not even thinking about money or taking trades, just plotting them where they should be based on what I see is happening, things don't turn out too badly. What I like the most when I'm in this frame of mind is that I am in no way affected by a trade that doesn't work out, I just keep working and take the next one that sets up. I have a very clear idea of where the stop would be, so this is a huge move forward, and although I don't add up the points to see what would actually happen if the trades were taken, I think I could be profitable.
Anyway... so back to working on the plan.
Looking over the charts last night, some days I would just get chopped up so much it was painful. Other days, adding contracts on each RET as price just trends up or down would be like picking up money from a bank machine that is just spitting it out. Keeping in mind that Lescor had an average winning day of $3000, and yet an average losing day of $2000, if we cut this by a factor of 10, is it possible for me to average $300 on good days and lose $200 on bad days? I know I can certainly lose $200 on a bad day, this is only 10 points.. LOL... but if I'm not discouraged and keep taking trades, then making 15 points on those good days is more than possible. (The number of bad days of course can't out number the good days)
Anyway, I just mention this because each time I get down to testing, I get discouraged when I run into trouble. But I know that I might not even need to fix anything, its just a string of losses in an otherwise profitable plan. I think that I have to keep going back to the drawing board to fix my trade criteria, to either be more selective with the trades I consider, to add more filters for context, to adjust the entry and exit points, etc. (Saying all this tough, I don't yet have a solid plan... I just have my ideas that I just keep adjusting my parameters on. Although I did extensive testing on the first setup, this by itself is not enough to trade with day in and day out. Too many good trades are missed, and there isn't anything about re-entering or taking a trade in the opposite direction. I need to add more to take advantage of other things that happen and of course to take advantage of the bigger moves. Essentially, I do have to test SLA further.)
")