Quote from Trader666:
Oh please... that's not what you said almost 7 months ago... you said the turning point was BACK THEN. And you were SPECTACULARLY WRONG:
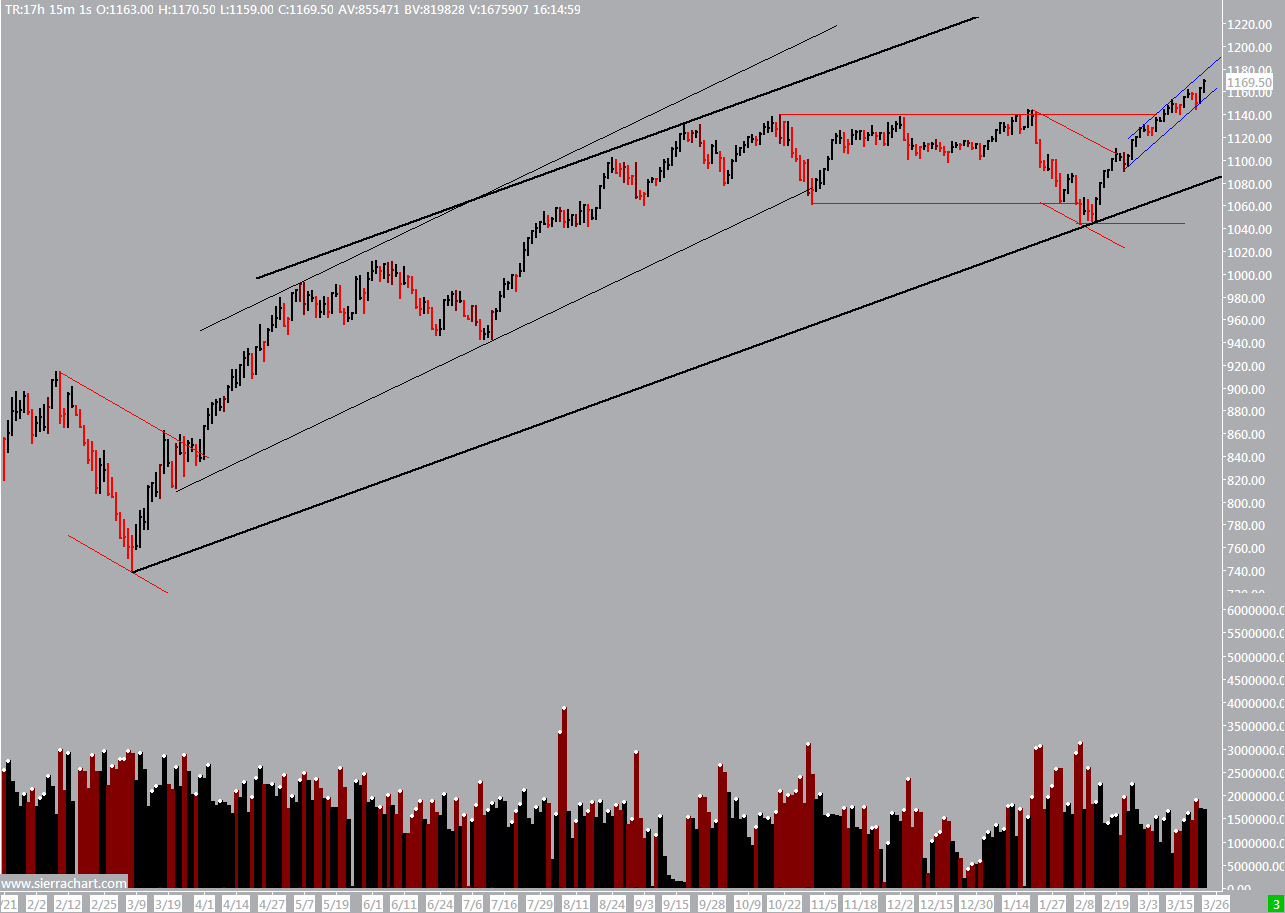
<img src=http://www.elitetrader.com/vb/attachment.php?s=&postid=2776348>
For those who are interested in how markets move in nested patterns, use the posted chart to try to buld the parallelogram that represents the Bull retrace.
It would be good to use something that is traded because you then have the two variables of the market to help you construct the trading atmosphere.
A de gapped ES with the rollovers included would be helpful.
As I have suggested doing this with regard to the granularity of the markets is the scientific approach and it eliminates noise and anomalies. completely.
Point 2 of the Depression parallelogram is the beginning of the Bull retrace; this point is not on the chart shown.
The point 3 of the Bull retrace parallelogram is showing on the illustration and it is the FTT of the second leg of the legs that form the Bull retrace. By annotating the first and second leg of the Bull retrace a person gets the opportunity to track the third and final leg of the Bull retrace parallelogram.
Thanks for posting that handy chart, T666. as time passes maybe more and more people can see that point in time for this Depressioin.
How has the annotation of this leg proceeeded? What moves have occurred within the parallelogram that forms this third leg.
I am really not using T666 by mentioning things in terms of NLP that will trigger his response. I do not consider him as just a foil of mine to create the opportunity to make comments on the markets. He is on his own and he does as he wishes.
Elsewhere another n00bie thread has begun. The person uses the word "scrambled" to recognize his contemporary mind functiion. he has made many decisions ovr 2 years working at a rate of 10 to 14 hours a day. Call it 5,000 hours of effort. He has saved 6 years of funds in terms of savings to be able to work on learning to trade. NIN has explained to him that the die is cast vis a vis NIN's appraisal of the n00bie's comments on a particular instrument. this was following TZ's usual commentary on how learning to trade has a given potential regardless of anthing in particular. These people are also on their own individually.
Trading is done on given fractals that all ly within the Bull retrace that is coming to an end on it's final movements. the n00bie prefers fractals that ae displayed on a platform where his choises are 1 hr, 1 dy and 30 minutes for bar duration. So he can't see the markets. T666 uses non trading illustrations he picks up somewhere to make his repeated points.
By looking at the nested fractals whose nesting is determined by building from the granularity of the market, a person gets to see the process unfold.
My minority view is based on an integral paradigm derived from the application of science in a logic that is dictated by the form of the information from the market (s).
Thus I view the Bull retrace ina different way than most. For me the Depression was announced in late JUNE of 2006.
Previously, I annotated some highlights of the progress of ending the Bull retrace. Those are still available since the thread has not yet been destroyed.
What is important to record here is how the nested fractals are influenced by the movement of volume and price.
T666's post does play to the last prior points I made on nested fractals. It also helps to understand how a savr learning to trade can get "scrambled in the process he undertook and which closed out on him as the amount of information he acquired greatly exceeds what has to be erased for him to be a trader. His 5,000 hours precludes his further progress and, as suggested by NIN, the die is cast.
Living and trading during the segments of a Depression is a significant experience. Just growing up in one is also significant.
Using parallelograms as the trend segments and nesting them in a family is a fairly simple and objective worthwhile training activity for becoming a trader whose mind has a resourse called inference alwys available for carrying out a routine.
On this chart you can see the progress of the ending of the Bull retrace. the third leg (a parallelogram) is after point 3 of the parallelogram that first formed the Bull retrace.
T666 has redrawn his arrow on this newer chart that he keeps updating to make his point about me. This was during the third leg of the Bull retrace parallelogram. It was at a significant time during the thrid leg in terms of the parallelograms that make up the third leg. as previously illustrated by me, i drew pertinent green limes to make a point ablout how trends can be extended. they also can be furthered by VE's and theu also can be diminshed by fanning due to internal type cases under a set of defined circumstances. The market is dynamic with respect to its containers.
I could give more emphasis to a concept rgarding the "original" aspects of parallelograms as containers. Suffice to say that the "original" aspect of the Bull retrace has expired. the bull retace is now in an state that is after the original point 3 and bfore the final FTT thatcloses it out.
During this period it was possible t point out intervening milestones that could, possibly, not be observed by some kinds of trading practioners. this is not a put down of those people nor their practises. But it is a comment on how people may want to be very sharp in making choises that close doors in their learning and training processes. for a lot of poeple the learning and training process nevr ends. Some of the reasons have to do with the advance of tchnology but the most apparent reasons have to do with the continuing growth of the mind and its ability to organize to differentiate by increasing its content with respect to inference.
This post points out some of these phenomena. Look at the red arrow. Look at the absense of volume. Look at the absense of annotation of any form. Look at the quote. This is an illustration provided to you by a person who has been in the same orientation for the duration of a college education.
The OP of this thread has a concern. Others share his concern or dismiss it based on their mental state of differentiation and available inference to match their sensory observations.
The envelope of the Depression parallelogram will probably last as long as the usual depression. People are being born and growing up in and being schooled in a Depression mentality currently. Nowadays and since the PC, people have been able to call recessions, recoveries, etc without fail. Markets are continually growing larger in their capacity and without regulation or integrity. It is not in the interests of many to change this in any way. New markets are appearing and flourishing all over the globe. A lot of IB are broadening to be able the handle trading about anywhere and any time.
The markets will always make their offers and traders will or will not take the offer. I imagined that markets would loose their granularityat some point for a while until I got the notion that is was simply not possible to have that happen. Thinking about this is probably not a big deal to most. but it is comforting to know that there will always be some level of granularity. How long does it take for a person to know that he knows this is true? Some people find out how long others do not.
It is nice to know that you know what the context is for trading. It is done by building from the granularity to the slowest fractal of our civilization in each of the markets used by civilization. What makes this Depression interesting is that it is going on now and all the parts of it are measurable and give us a context for building our minds and building our wealth.
Trading becomes like driving a car when the driver has a mind that is differentiated for either driving the car or trading the market.
ticks, contracts and print times are all granular. Nine cases for adjacency emerge. Six are "internal" and one is "external". Two cases are the most frequently used by people to figure out if they can get an "edge" and make use of it.
Most ET readers have no idea what I am talkingabout when i mentiion adjacency and its cases. If so, the person is still an apprentice carpenter. Why couldn't Lo send the troops back to the drafting board when they handed him a P, V chart that never could happen in the history of any market? the answer is that he and his associates do not have "inference to gain perception of what they are sensing. It is not a good idea to remain an apprentice any longer than necessary. A parallelogram is not a difficlut concept to come to understand.
Obviously when the thread started, not many people knew that granularity was the foundation that dictates the basis of how markets must be traded. Consequently, for taking a person through learning to trade, it is just a simple necessity to examine whether he is capble of driving a car. If he is then he can learn to trade if he can think critically as he does his drills.