I am going to start my journal of NQ trading. I am in Central time zone
I use Wyckoff methods and Price action in trading.
there is only wave volume on chart, no bars, no fancy indicators... simple...no noise
here is today's trading.
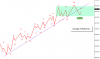
Trade 1: 3640 is support I got from hourly chart. the secondary test wave had only 1600 contracts, much lower that prior down wave of 12,300 contracts, it told me supply exhausted, demand overcame supply, after entry, the first up wave has 7100 contracts, sign of strength
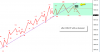
Trade 2: still near 3640 area , price had COB, the test of bottom of TR was the entry, it was also halfway back of COB up wave. volume was 4400, higher than 3100, but price did not make LL, effort vs result
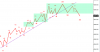
Trade 3: it is the same as trade 2, the bottom of TR, the 1600 volume told me the exhausting of supply. since it was much lower than last down wave
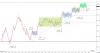
Trade 4 and 5: they were JOC retest, the text book setup
I use Wyckoff methods and Price action in trading.
there is only wave volume on chart, no bars, no fancy indicators... simple...no noise
here is today's trading.
Trade 1: 3640 is support I got from hourly chart. the secondary test wave had only 1600 contracts, much lower that prior down wave of 12,300 contracts, it told me supply exhausted, demand overcame supply, after entry, the first up wave has 7100 contracts, sign of strength
Trade 2: still near 3640 area , price had COB, the test of bottom of TR was the entry, it was also halfway back of COB up wave. volume was 4400, higher than 3100, but price did not make LL, effort vs result
Trade 3: it is the same as trade 2, the bottom of TR, the 1600 volume told me the exhausting of supply. since it was much lower than last down wave
Trade 4 and 5: they were JOC retest, the text book setup
")