

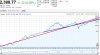
Long. Term. Logarithmic. Chart.

See how the red line is fit to the bottom of the '87 crash and the dot.com bust? Warren Buffet consistently admonishes not to bet against America. I did a rough "best fit" (probably better read as "ok fit"--it picks up the pieces after dot.com) line for the red line and again with blue to give a more conservative recent rate of growth. Both are still suggestive of continued gains.
It really does a good job of underscoring the magnitude of the 2008 bust. No other crossing of the line comes close to the angle of the perpendicular cross that year. Also, notice the bubbles and the spikes and why they're called such.
20-odd year bull markets have precedent, why can't this be one?
For what it's worth, I'm a timid deer around 2,450 running for cover at the slightest scent of bear shit. (*sigh* I can make the argument, but still be irrational enough to succumb to emotion).
I appreciate all naysayers to this--inflammatory or constructive. You're my vital check against my own stupidity.
See how the red line is fit to the bottom of the '87 crash and the dot.com bust? Warren Buffet consistently admonishes not to bet against America. I did a rough "best fit" (probably better read as "ok fit"--it picks up the pieces after dot.com) line for the red line and again with blue to give a more conservative recent rate of growth. Both are still suggestive of continued gains.
It really does a good job of underscoring the magnitude of the 2008 bust. No other crossing of the line comes close to the angle of the perpendicular cross that year. Also, notice the bubbles and the spikes and why they're called such.
20-odd year bull markets have precedent, why can't this be one?
For what it's worth, I'm a timid deer around 2,450 running for cover at the slightest scent of bear shit. (*sigh* I can make the argument, but still be irrational enough to succumb to emotion).
I appreciate all naysayers to this--inflammatory or constructive. You're my vital check against my own stupidity.


 ;
;