The Trouble With Scribbles

This is an example of what I call the LITHA trade (Leave It The Hell Alone). It's the sort of thing that is attractive to those who trade while at work or in class or wherever.

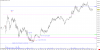
Here one can see the pre-open range and the initial move up to 19 at the open. Price then drops to 4401. Given the pre-open range and the failure of price to drop below 01 on the test, making a double bottom instead, the trader, if he happens to be watching at the time, can enter at 02 or 03 or 04 (doesn't really matter) as a reversal then LITHA until it reaches 19 or thereabouts.

Are there any guarantees that it will reach 19 and not drop back to the entry price? Of course not. But this sort of "setup" is an option for those who want to participate in intraday trading but aren't in a position to track price continuously.

View attachment 151501

The sellstop or targetstop or whatever your platform calls it would be placed at 18 or 19, depending on how greedy you are.

And there you are: the LITHA trade. Took a while, but if one is at work, who cares?

upload_2015-4-16_13-58-2.png
 
And there you are: the LITHA trade. Took a while, but if one is at work, who cares?

View attachment 151512
So basically you're saying that after price had gone up over 10 points, we could have bought at 02 or 03, had we done so over an hour before your post?

Price is hugging 4419, and it looks like its going down, but I will tell you an hour from now if you should have sold or not.
 
Ok.. one last chart. I hope you don't mind me posting it here B1S2, but its just like you take other people's charts to comment on them so I assume this is ok! :)

So here is that wonderful chart that 40D posted.

I would caution all to do their own due diligence rather than assume KP understands any of this well enough to warrant adding his commentary to the chart work of others.

For example:

these 5 min bars

They are not 5 minute bars. Not even close. Not that that should matter, as what matters is price, and the continuous flow there of. You still think and see price in terms of bars, which leads to this gem:

price comes back down and price closes in the middle of the bar which I call a low

All a "close" is is just where that bar was trading when its data-increment was fulfilled. You can call a "close" a low, and I could call you a "friend," but merely calling something that which it is not will not make it so.

if I use the method that he has used in the past to trace out the price action that is happening

Which, because you do not know how price flows, you have no chance other than random luck to get right. In this case, luck let you down. Let's look at a 1 minute bar interval so you can see there was no "lower low."

Poor fuckining idiot.JPG


Then it comes down, and break the previous low (which is where it opened), and therefore makes a lower low.

No. No it doesn't it.

so this tracing that I've done absolutely qualifies.

No. No it doesn't it.

this has all the makings for a short...

No. No it doesn't.

this has all the makings for a short... was one taken?

Not by me. Perhaps by you?

And this is what I would believe if I understand what he is trying to show

As usual, you do not understand. Not even close.

But there is no mention of any of this

You mean my scratched short? How could I possibly mention what exists only in your imagination?

All that he means to imply is that somehow the long was obvious on this 4th breakout, and no mention of any other possible trades.

The price action that followed that fourth test was different in kind from what followed the first three. It is not my fault that you are unwilling to see that. In order to understand how to trade it so as to take advantage of that difference you would need to understand how to use a retracement entry to your advantage.

Breakout Study Final Conclusion.jpg
 
I would caution all to do their own due diligence rather than assume KP understands any of this well enough to warrant adding his commentary to the chart work of others.

Since we both agree that price is continuous, and since you even say you can trade a 5 minute chart by just watching the right tick, then I think we need to dig a little deeper than just 1 minute bars you use to illustrate. So here is the chart of the action.

NQ-201506-GLOBEX  5 Sec   #6 2015-04-16  11_25_05.057.png


You see, I have been trying to figure out how you're able to get such amazing and tight entries, and yet you seem to never be sucked into a (EDIT: wrong word used at first) bad move. Look at this second chart attached. I marked your entries on the chart via the red rectangle. I'm not sure where you entered as on this day you just mentioned your price for a long. But given that these are 5 second bars, and given that there is hardly anything to go on, your entry must be based on really micro price action. How on earth do you get long here having caught the very bottom? And yet everything you show, you show via 1 or 5 minute bars.
 

Attachments

  • Mar 24 - 5 sec.png
    Mar 24 - 5 sec.png
    48.1 KB · Views: 46
Last edited:
For those who are interested in the sort of hindsight schematics used to illustrate the RSI Grail method, here are the trades, using 15m bars, that one would have made by applying the SLA/AMT rules following:

upload_2015-4-16_14-57-45.png


Where 4440 came from:

index.php


upload_2015-4-16_14-58-30.png


upload_2015-4-16_14-58-54.png


And an updated copy of the range chart above:

upload_2015-4-16_15-19-48.png
 
Last edited:
Price is hugging 4419, and it looks like its going down, but I will tell you an hour from now if you should have sold or not.

Yup... I was right. Here we are an hour later, and as promised, I would like to tell everyone about the trade. I would like to point out how we were unable to continue going higher after the breakout. 20 contracts sold short for over 5 points is not too bad. :D

NQ-201506-GLOBEX  1 Min   #5 2015-04-16  12_02_05.976.png
 
I have been trying to figure out how you're able to get such amazing and tight entries

You are wasting your time. And mine.

I think we need to dig a little deeper than just 1 minute bars you use to illustrate.

Again, if someone truly is interested in learning anything about scribbles, kp is not the example to follow. Do your own work, and do not use his as a model. Come up with your ideas based on your own observations.
 
You are wasting your time. And mine.
I don't consider it a waste of time.
Again, if someone truly is interested in learning anything about scribbles, kp is not the example to follow.
I'm not trying to teach anyone. I'm trying to learn but its really hard to follow when what you show is extremely incomplete. Did you put on a trade when price hit 4419? Surely that was a juicy area to be watching, and it was still way before your cut off time of 30 mins before the close.
 
Back
Top