The Trouble With Scribbles

View attachment 151219 Would have been?:

On the surface of it, yes. But of course one would have to exit the first long in order to enter the short, and one would have to exit the short in order to enter the second long. Which is where the SLA and AMT come in.

If you're seriously interested, I'll go on. But I don't want to play Gotcha. I've traveled this road too many times.
 
On the surface of it, yes. But of course one would have to exit the first long in order to enter the short, and one would have to exit the short in order to enter the second long.
Sure. I was thinking,
Long at 4402.5 ish. Stopped for -3 or so
Short at 4392 ish. Stopped for -3 or so
Long at 4402.5 ish.Possibly stopped for +3, or maybe at 12ish for +10 if you rode out the first retrace
 
There is ample evidence of "real-time" calls, before the fact trading plans for many particular days, and trading results, p/l's ect within the ET archives that can and have been easily found by every one sincerely interested enough in the scribble approach to give it a fair shake.

The reason no scribbler is likely to meet your continued demands for such calls and p/l's is that in the past, when this very information was provided, the result was not "Ok, thank you very much." Instead, those making the demands typically continued or even intensified their demands. The truth is that for someone who seeks evidence outside of what ought to be expected from trading forum participants, no level of documentation will be sufficient.

Today critics choose to call price action trading scribbles, and back in the original SLA thread the critics derisively called it "kindergarten lines." What's old is new, both with respect to the critics and the approach itself. If the current participants of ET wish for "proof" they will need to search the archives. It is not fair to expect us to post a fresh batch of calls and p/l's for every new bunch who decides that they are entitled to such information.

Here is the original SLA thread: If You Can Draw A Straight Line . . .

It is a gem. If you were to first read DbPhoenix's FREE SLA/AMT pdf, and then work your way through that thread, you would likely have the basis for understanding at least what questions to ask. And no matter what method you use to trade, if you do in fact trade, learning what is in that thread can only help you.

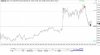
Here we see an interactive brokers chart of a scribble student showing that he was able to sell short near the high of the day and cover profitably near the low. If you do not know how to discern this information from an IB chart, you can follow the link above the chart for an explanation to help you.

If You Can Draw A Straight Line . . .

index.php


Here is the chart of a scribble student with levels marked off prior to the session start, showing that the scribble student again was able to sell short near the high of the day and again cover profitably based on reading price action alone near the low of the swing. Note the actual p/l at the bottom of the chart.

index.php


Finally, here is a record of profits withdrawn by a scribble student during his second month of live scribble trading. Again, this is not new. All of these charts, p/ls, along with trading plans, and many other examples were posted in the original scribbles SLA thread.

index.php


I humbly submit that the scribblers made an honest and sincere effort very early on to show that this method could, was, and is being traded under real time market conditions in a consistently profitable manner. However, I also stand by my current opinion that more than enough substantiating information is available to those genuinely interested in the scribble method right here in the ET archives. If you are truly interested in learning, vetting, testing, and possibly trading this method, then do as reasonable people do: Do your own due diligence. It makes no sense to continue to demand fresh proof of viability when plenty has already been made available to you if you were only to look for it.

EDIT: DbPhoenix's post in another thread prompts me to add that of course any and all evidence could be faked. What should really matter to you is whether or not there is a trading plan in place before hand against which to check the purported "results." I would invite you to go to the original SLA thread, and check any of the results I posted against the charts and my stated plan which were posted ahead of time. I would also suggest you use the same criteria elsewhere on ET and other forums as well. If someone claims to be making $Gazillions, what matters is not his results, but the plan by which he achieved them. And if the plan is not shared, then the results are suspect at best, imo.


Good profit.
Just a bit curious, Aug 24 and Aug 31 (2013) were all Saturday, how could you day trade?
Unless these statement days are not the correct days that you placed your trades.
Anyway, it is not important, and you don't need to answer that.

That statement was two years ago, and I think you must profit much more this year as you increase your car size (10-20 as you indicated in some of the recent posts).

I got to say that I like your posts/trading calls, as they were more straightforward, honest and clear than some other SLA guy.
 
Last edited:

It was a while ago, but why no short on the lowerhigh at that occured at your first pre-determined line, 40 ?
 

Attachments

  • fff.jpg
    fff.jpg
    90.4 KB · Views: 104
Sure. I was thinking,
Long at 4402.5 ish. Stopped for -3 or so
Short at 4392 ish. Stopped for -3 or so
Long at 4402.5 ish.Possibly stopped for +3, or maybe at 12ish for +10 if you rode out the first retrace

If exiting the trades at -3 doesn't freak you out, then fine. But not everyone will react the same way. When playing with various entry and exit scenarios, however, it is necessary either to watch the price move via replay or convert the chart to 1m intervals so that one can see what price is doing "inside" the bar. A static chart doesn't say much beyond the OHLC.

For instance, you've chosen a 15m interval. That can be an eternity for a fearful trader who finds himself in the red within seconds of his entry. He may therefore want to exit immediately if his trade doesn't "go". If he can pull himself together, he will note on a 1m chart that price rejects the lower limit of the range -- also immediately -- and re-enter the short. If he's focusing on price movement rather than on the state of his trade, he will then note that the next bar doesn't make a lower low. This is a red flag. And this is when price rallies all the way to 96. This would be unacceptable to just about anybody. This rally attempt however fails quickly, and the trader who isn't thrown by all this back-and-forth can try again, this time getting all the way to 86.5. If he isn't scaling out, he can then exit on the break of the stride, which would put him at more or less breakeven and ready for the next breakout, either below or above the range. If he is scaling out, he's up 5+/-.

This is what price action trading is all about: a continuous assessment of the balance between demand and supply. It is not just entering for one reason or another and placing a 100pt stop and hoping everything works out. When written out, it seems impossibly complex. In practice, though, this is all worked out in advance: where am I going to enter, how much price risk will I assume, what will I look for to tell me that the trade isn't working, what criteria will I use to tell me whether or not to re-enter and if so where?

One reads the script and learns the lines ahead of time. When the curtain goes up, all one has to do is perform.
 
Just a bit curious, Aug 24 and Aug 31 (2013) were all Saturday, how could you day trade?

At the end of everyday back then I would request a check for the day's profits. The dates correspond to the date I received the check, not the date the profits were earned. That is why I referred to them as "profits withdrawn."

I got to say that I like your posts/trading calls, as they were more straightforward, honest and clear than some other SLA guy.

I had no problem learning from him, so I'd say I thought his explanations very plain and straightforward. In fact, I really do believe that if he were to teach this the way most here seem to think he should, it would have been far more difficult for me to have learned how to trade by price. I think he should continue to do what he does and to do it as he has been doing it. This way perhaps a few will get it.

Imo, the masses want a trade calling service. I wanted to learn how to trade for myself. Most will no doubt disagree with me, but there is no benefit to the student of having the teacher call out entries and exits. Yes. Most will disagree. But this is a skill. PGA players who use swing coaches do not learn by watching the swing coach hit buckets of balls at the range. I no longer take golf lessons, but the way I learned to play golf was very similar to the way I learned to trade: I found someone who could give me information on how to start and feedback as to how I was doing. His method of trading and his way of teaching it may not be a good fit for you, or for many. But should he on that basis change? imo, it is the student who must change or move on, not the teacher. IMO.
 
Last edited:
It was a while ago, but why no short on the lowerhigh at that occured at your first pre-determined line, 40 ?

Without having the ability to replay that day tick by tick, I can't say. If you were to insist on an explanation, I would think the most likely is that I didn't understand what was going on. I have always been very good at sitting on my hands and patiently awaiting a clear opportunity.
 
Sure. I was thinking,
Long at 4402.5 ish. Stopped for -3 or so
Short at 4392 ish. Stopped for -3 or so
Long at 4402.5 ish.Possibly stopped for +3, or maybe at 12ish for +10 if you rode out the first retrace

I traded it quite a bit differently, to tell the truth. I don't feel any good can come of saying exactly how I traded it. I will say I do not trade BO's the way you describe your entries, unless it occurs at the open. And by "at the open" I mean real soon after that bell- not 5 or 10 minutes later.

But I will give you this much: Go back to the post you made in the Al Brooks thread about the afternoon's range, and instead of looking for a horizontal range, look for the downward sloping range off the AM session high. Draw the upper limit of that channel, then apply AMT to find the oversold reading above yesterday's high. That, imo, was the trade for the afternoon, with an entry anywhere between 5 and maybe 8.23/8.50 depending upon how one plans his or her trades according to SLA/AMT.
 
Without having the ability to replay that day tick by tick, I can't say. If you were to insist on an explanation, I would think the most likely is that I didn't understand what was going on. I have always been very good at sitting on my hands and patiently awaiting a clear opportunity.

This is missed by practically everybody. If ever and whenever a trade enters a territory that he hasn't planned for and which he finds befuddling, he ought to get out. Without hesitation. Being out usually resolves tension immediately, at which point he can begin to observe and draw at least preliminary conclusions, thereby readying himself to re-enter.
 
Back
Top