
One can obtain surgical entries without using fast timeframes, in fact, many times superior. Fast timeframes might even give illusion of security when in reality they guarantee nothing abut the outcome of your trade, since in the end, nothing will.

You are using an out of date browser. It may not display this or other websites correctly.
You should upgrade or use an alternative browser.
You should upgrade or use an alternative browser.
The TREND is your friend.. The biggest lie ever!
- Thread starter MarketAddict
- Start date

>ND
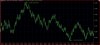
Attached is a 50 tick chart from yesterday. As you can see the price movement is just as easy to read as any 1 or 5 minute chart, and is really by the book. The advantage is, of course, the opportunity for earlier entries and exits than would have been presented on 1 minute or larger charts. True, trading off such charts does require more concentration. The trick is to find the number of ticks for the contract that makes the price movement readable. Too few ticks will not do it.
I once felt the same as what you and the others are saying. However after experimenting,
I wished I had shifted to tick charts much earlier. I felt the same way when before internet trading I sat in the broker's office all day plotting 10 minute charts by hand for Nikkei futures.
Then with the internet when 1 minute charts came along, I thought 'what in the world has my trading life been up till now'.
Granted, how you read charts and your trading plan may not make such small time frames practical. And please don't misunderstand that I use tick charts for scalping. I do scalp from time to time. But I mainly use tick charts for the purpose of early entry to a run.
Attached is a 50 tick chart from yesterday. As you can see the price movement is just as easy to read as any 1 or 5 minute chart, and is really by the book. The advantage is, of course, the opportunity for earlier entries and exits than would have been presented on 1 minute or larger charts. True, trading off such charts does require more concentration. The trick is to find the number of ticks for the contract that makes the price movement readable. Too few ticks will not do it.
I once felt the same as what you and the others are saying. However after experimenting,
I wished I had shifted to tick charts much earlier. I felt the same way when before internet trading I sat in the broker's office all day plotting 10 minute charts by hand for Nikkei futures.
Then with the internet when 1 minute charts came along, I thought 'what in the world has my trading life been up till now'.
Granted, how you read charts and your trading plan may not make such small time frames practical. And please don't misunderstand that I use tick charts for scalping. I do scalp from time to time. But I mainly use tick charts for the purpose of early entry to a run.
Attachments
Last edited:
If you configure your automation to focus on Time & Measurement, as opposed to Levels & Lines, then you should see a vast improvement.
I like your idea about automating, but stats show that no system is consistent, the reason being psychology!
So, it makes perfect sense to develop and test your logic with reverse engineering - start by using Time as your first condition, then add conditios based on MEASURED MOVES across different timeframes - no matter what timeframe you look at, price will always be in the same place - what you need to work out is the max and min "areas" that price will go next, based on MM's - you will then have a system that is repeatable enough so that you will consistently make money using it.
You have a major advantage over most with the ability to programme, as your biggest obstacle is psychological - remove that and you can quickly turn your 200 per day into 2K per day.
The OP is mostly correct, in that "most" of what you read in books will not help you make money - whenever the casino changes the odds a very small bit, for promotions or competition, it usually costs them a lot more than they thought it would - to never change your odds you must remove the psychological barriers.
J_S
What do you call psychological barriers? "Levels & Lines" done in right way clearly shows you are buying a dip in trend or you buying a leveled support area in larger pattern trend, but does matter if you have done it correctly which I don't believe is psychological barrier but price structure knowledge.
There are trade offs in trading, always has been and will never change, you scalp ticks most who done it long time will have lowest losing percentages and those who go after homeruns have biggest losing percentages, I really doubt this will change and stats shows me had nothing to do with psychological barriers as I do all my back testing by programs. There is huge "edge" if one is buying as opposed to selling, selling one can achieve more homeruns cause the fear in the market whereas buying and so many more newbies only buy have always shown me stats of more false signals.
I think don't think "biggest obstacle is psychological", I think most don't have a good enough with ample sample size back tested method.
Let's face it, people don't know how to "think", you buy a book and you think you don't have to study it? I think people try a few times of making it work and toss idea away, and most don't that some ideas the book should generate to form other ideas to test out.
I have lady friend who lives in Vegas, 18 of past 20 years she has made between 100-300k playing video poker shooting for Royal flush and she nails it 2-4 times a year at casinos that play 4800 to 1, when whatever casino reduces odds she stops playing there, casinos never lose by doing this, they lose the professional gambler that play there each day but most smaller or tourist players never even know it. It is just like almost one deck shoes in Vegas has vanished, I use to fly to Vegas each weekend to play then at seven casinos that had one deck shoes, as I counted cards and did well most weekends, casinos give me free rooms, food, entertainment and sometimes free flights, Southwest airlines back then would give free roundtrip every six flights. Casinos only lose when economy gets bad.
I think I have some details in relation to casinos losing when they change the odds, will look up later.
Psychological barrier is when your mind stops you from doing what you need to do - as mentioned several times, you can explain or "show" an adult exactly what to do, and the likelihood of them doing it is very very small - the reason being their mind will not allow them to do it!
Many think I jest, but I can assure you I do not, for I have gone thru the "mind game" at great expense, both financially and personaly - a.k.a the school of hard knocks.
In summary, it really does not matter what way you define the "trend", as price moves the same way across all timeframes, so what does matter is what way you decide to trade, as there are some ways that are far better than others, and the better ways just happen to be the ones that don't allow your mind to fuk you up
J_S
Psychological barrier is when your mind stops you from doing what you need to do - as mentioned several times, you can explain or "show" an adult exactly what to do, and the likelihood of them doing it is very very small - the reason being their mind will not allow them to do it!
Many think I jest, but I can assure you I do not, for I have gone thru the "mind game" at great expense, both financially and personaly - a.k.a the school of hard knocks.
In summary, it really does not matter what way you define the "trend", as price moves the same way across all timeframes, so what does matter is what way you decide to trade, as there are some ways that are far better than others, and the better ways just happen to be the ones that don't allow your mind to fuk you up
J_S
1 min chart can be pretty noisy when price is chopping around. But sometimes it can show good details when price is not choppy.
2 min chart is less noisy and looks ok for trading, but sometimes it is too big and details can only be seen in 1 min chart.
5 min chart is even bigger and hard to see details...I aint sure what is the advantage of 5 vs 2 and 1 min charts.
Since I generally only trade 60-75 minutes a day in ES/NQ, one minute is more than enough to have the volume I need for doing many trades and up to 25 separate signals. Since I average this past week being in them 2.8 minutes, one minute way to go for me. What most see as noise, I see clearly what market presents to me in form of S/R and reversal patterns, knowing what to expect on "average". I find two is ok, but don't make as much, little less false signals. I love five minute charts but refuse to kill the day by staying in front of screen all day, risk is greater while profits are about the same, but reasonable losing percentages, but number of trades greatly reduced.
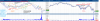
The advantage between different timeframes for me number of trades that I am banking will continue to work, five minute is definitely far easier to trade as less is going on, I would highly recommend the five minute to newbies, gives one much more time to think. Enclosed is method I have automated but doing slightly different trend identifier, but had done this method for years when I sat in front of screen all day. One should always back test anything you read to understand risk and targets best to be used, I am highly conservative trader, so I risk and target much smaller than most, Unless it is 60 minute plus systems, I never trail stops, but that is what I prefer to keep overall risk down and I rather get what I can and go after next signal.
Attachments
If you are day trading and only trying to learn how to trade trends, then you are going to fail 100% guaranteed.. Trends are just a small part of trading, and if you don't study the rest of the market then you are toast.. The odds are against you.. Whether you believe me or not, this trading game was design to take your money.. You are going against the smartest people in the world.. Scientists, mathematicians, billionaires and etc... Do you think your $20 book that you bought from amazon is going to save you? Give me a break!
Now back to the trend.. If the trend is my friend then how come it only shows up 30% of the time? What kind of friend is that? Call me stupid, but I don't want a friend like that.. In trading you have to learn about more than trends in order to survive.. The market is always trying to screw you over and trap you so you have to become aware of this.. There are 7 main things the market is trying to do constantly. Maybe not every single day on one instrument, but you will see it throughout the whole market.. And this is one of the reasons why the market is hard to trade because the market doesn't act the same everyday...
The 7 things are 1) short/long squeeze (fake trends), 2) consolidation, 3) range, 4)strong trends, 5) semi trends, 6) breakouts, and 7) reverses... I'm too lazy to explain every single one of these so you will have to study them yourself
The market loves to trick you into believing that your ONE system is going to make you money.. And then 3 months from now your ONE system is going to stop working and I wonder why? Is it because you was trading a trendy market and now it's not trending lol..
The best way I found to trade the market is to wait for the market to be in a predictable state.. Yes, a predictable state.. What does a predictable state look like? When the market is bouncing off extreme levels is what I call a predictable state.. Trend lines, s&r, and channels... Yes, I know they are hard to draw in real time for most people, but guess what? It's supposed to be hard.. If it wasn't then the game would be easy, and the big boys wouldn't like that.. The best thing I can tell you is to practice everyday in real time and in non real time.. It took me 9 years to see what's really going on.. and I'm still learning
Now, I'm not here to beat down trends because you can make a lot of money from them if you know how to hold onto winners.. But the real trends only appear 30% of the time.. Most people get confused and think that a temporary direction is a trend.. But real trends last for the whole day..
If you are a struggling trader, and you always get caught in chop, then you will need to stop trading and get familiar with the 7 things above.. Plus, you will need to get familiar with trading predictable states...
Interesting, I've started looking at the markets now mainly forex exactly how your describing, its giving a whole new direction to my trading and a deeper understanding of how the markets work,looking at price not in the simple terms of just buying and selling but rather who's doing what,one example would be what are the triggers for retail or certain participants to own or disown an instrument..currently working on applying it into a workable approach
But real trends last for the whole day..
This is completely wrong. I can show hundreds of charts to proof that.
Trends last till they finish, that's the only certainty. I daytrade trendfollowing and have longterm average 2-3 trades a day.
Just one chart to proof it. 10/07/2015. From opening we dropped about 24 points in the ES and then we went up again 21 points. So what was the daily trend? Long or short? The correct answer is: the trend was first short and then long.
Last edited:

Interesting, I've started looking at the markets now mainly forex exactly how your describing, its giving a whole new direction to my trading and a deeper understanding of how the markets work,looking at price not in the simple terms of just buying and selling but rather who's doing what,one example would be what are the triggers for retail or certain participants to own or disown an instrument..currently working on applying it into a workable approach
I'm glad that you are opening your eyes... People will tell you trading is easy.. all you have to do is buy when price goes up and sell when price goes down... That doesnt work for retail traders... Because we have to trade with stops and be more careful about our entries and exits.. If you are a full time trader you should know what I'm taliking about.. Heck, even if aren't you still should know what I'm talking about (I hope).