I trade on a purely mathematical model. This model identifies a big number of scenarios that are grouped around different strengths of the trend. The system identifies, based on past data, which scenario is most likely to develop. Basically it starts by eliminating all the scenarios that dont fulfill the conditions....
Ok. Some general observations in hindsight that I would like to be able to recognize at least partially in foresight in the future. It goes to my prior question in how to go about understanding how a trend may develop on a given day. Also how one might reduce the number of trades taken to begin to match that of the 'meat' of the movement on a day.
About 'the trend.' I have more or less dismissed it over the years, as it seemed to me as if the trend was something that always exists, but more or less exists in various states or duration. But then again, 'the trend' when discussed on forums seems to devolve into a discussion of semantics where people may generally may mean the same thing, but argue about strict definitions. But in the end, in its simplistic form, to profit in directional trading, one has to be aboard some type of trend or another to be able to profit. Weather that trend lasts for 5 seconds and 4 tics, or 5 hours and 50 tics. It is the only way. But I digress...
In what I was saying before about isolating types of days, let me post a few pictures of what I mean. Simple little indicator that just plots the Main Moves of the day. The premarket Main Move, the RTH main Move, and then everything encompassing 24 hours. This idea was spawned by an older poster from many years ago PB who no longer posts under that name.
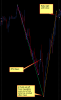
So here is just one type of trend day(exhibit 1). You will notice the RTH Open, and then the market just goes straight up with minimal pullbacks, and closes near its highs. Specifically I was looking @ days where the Market opens, and drops no more than 3 points(shallow open) before rallying the entire day(shallow close). The illustration of the charts or TF I'm showing isn't important, just to visualize what I am explaining. I have noticed for the UP CASE ONLY, this type of day occurs between 2-4 days per month. Also typically an equal number for the down case. A good strategy could be buying near open and holding all day.
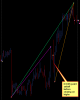
On a similar vein, there are days where the Market will open, sell off a larger number of points(ES), 3-9 points, and rally higher and close near its highs(exhibit2). I wouldn't call this a short squeeze day, but similar to the first, just that there is a smaller trend counter to the main trend on the day. These days I have noticed occur on a similar frequency of the one listed above. A good strategy could be selling near open(or waiting), buying near the low and holding all day.
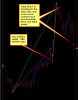
Another type of day(exhibit3), is where the market could open, sell of slightly(<3ES), rally nicely for a portion of the day, but then kinda 'stop short,' and reverse into the counter direction. This also seems to occur with a similar frequency(for the up case) as the two mentioned above. A good strategy could be buying near open and possibly selling the healthy counter move.
A shallow selloff can also be attached to a deep closing, and vice versa. There are also other types of ways I have observed the trend developing on any day, but that would be a lengthy post to list them all.
So, I'm wondering if there is any use in delimiting days this way in order to begin understanding the trend? Or more generally, just food for thought for anyone else doing their own market studies.