
Katie say the s$p which we all know is a risk free money printing index is headed up 7% to a guaranteed 2250, its all in the charts according to her technical analysis so just keep buying every chance you get, if you can mortgage the house, take an equity line out and borrow against your credit cards, this is a risk free 7% which would take decades to earn in any savings account, the break out should occur next week after major companies report earnings, that should give the markets at least a 2-3% jump next week to new highs and by may 2250 will be here, so just keep buying, she said there is a triangular wedge pattern showing up on the s$p and that means its going to break out to the upside....just keep buying, this is a no risk free money printing market and will be for the next 10-20 years.
The S&P 500 is less than 1 percent from its all-time high, and according to one top technician, more records are just around the corner.
"We've already seen new, all-time highs registered by major indices in the U.S. and globally," said BTIG's chief technical analyst, Katie Stockton. "The S&P 500 has yet to do that, but I think it's a matter of time."
Stockton pointed out that despite a negative outlook for earnings, the initial reaction has been quite positive. "We're seeing breakouts [on earnings] on an individual stock level," she said. "The Russell 2000 has hit a new all-time high, and I think the S&P 500 is going to break out from what has become a bit of a triangle formation on the chart."
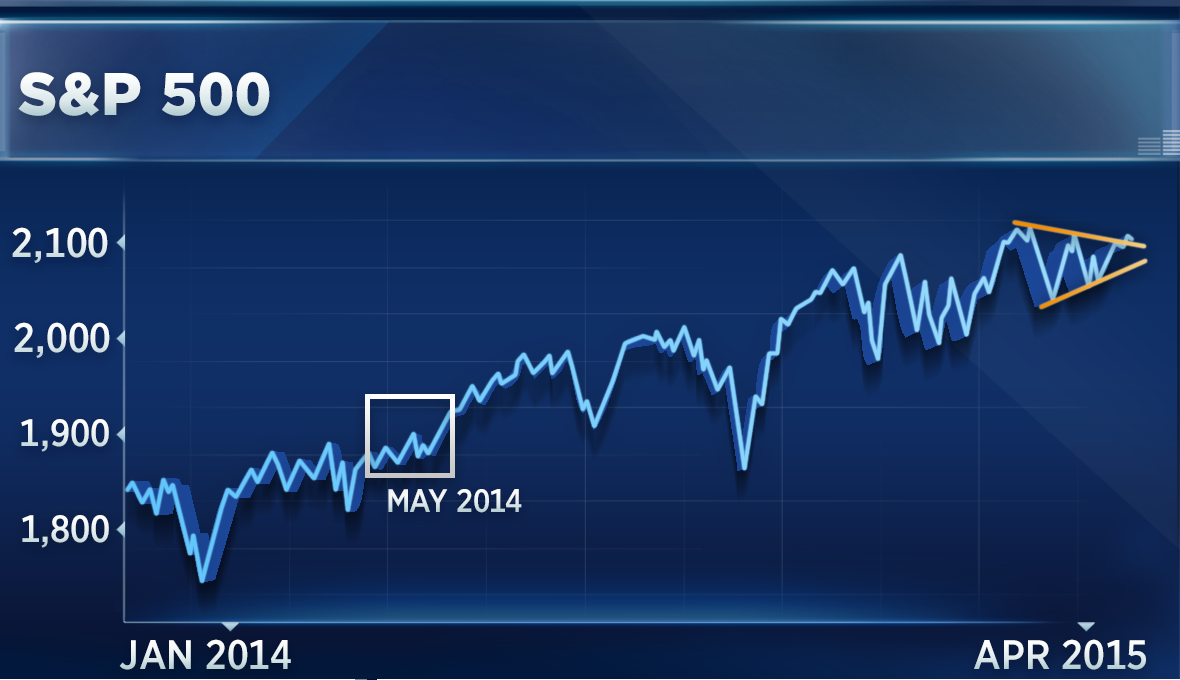
Technicians often look to wedge or triangle formations to find inflection points. The theory goes that as a stock begins to trade in a narrower range, eventually a breakout will occur, and it's usually higher. According to Stockton, the triangle pattern occurring in the S&P 500 is signaling that stocks will rally.
"There's really nice upside here," said Stockton.
Another major indicator that Stockton noted is market breadth, or the number of stocks that are participating in the rally.
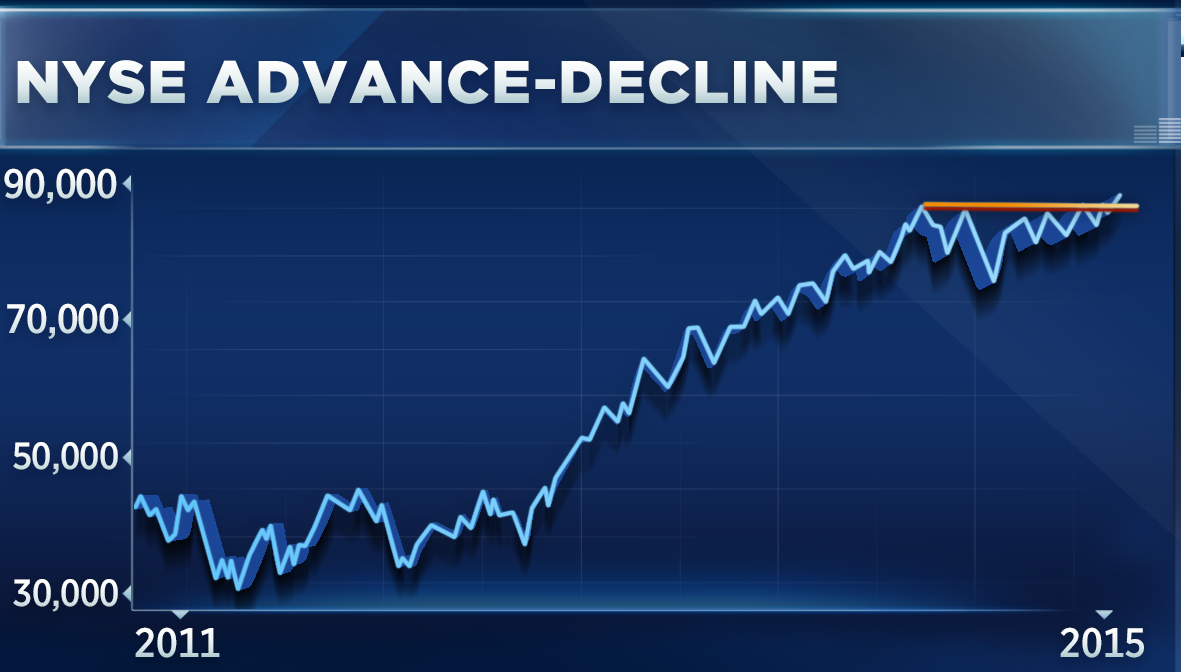
"The cumulative measure of advancers to decliners has reached a new all-time high ahead of the S&P 500." In other words, the rally is not limited to just a handful of large stocks, but rather a number of individual equities.
"The uptrend still very much has positive momentum," she said. "With the support of that breadth, or market participation, I think the rally still has legs."
So how high does she see it going?
Stockton said that the S&P 500 is well on its way to 2,250 in the short-term—nearly 7 percent higher than current levels.
The S&P 500 is less than 1 percent from its all-time high, and according to one top technician, more records are just around the corner.
"We've already seen new, all-time highs registered by major indices in the U.S. and globally," said BTIG's chief technical analyst, Katie Stockton. "The S&P 500 has yet to do that, but I think it's a matter of time."
Stockton pointed out that despite a negative outlook for earnings, the initial reaction has been quite positive. "We're seeing breakouts [on earnings] on an individual stock level," she said. "The Russell 2000 has hit a new all-time high, and I think the S&P 500 is going to break out from what has become a bit of a triangle formation on the chart."
Technicians often look to wedge or triangle formations to find inflection points. The theory goes that as a stock begins to trade in a narrower range, eventually a breakout will occur, and it's usually higher. According to Stockton, the triangle pattern occurring in the S&P 500 is signaling that stocks will rally.
"There's really nice upside here," said Stockton.
Another major indicator that Stockton noted is market breadth, or the number of stocks that are participating in the rally.
"The cumulative measure of advancers to decliners has reached a new all-time high ahead of the S&P 500." In other words, the rally is not limited to just a handful of large stocks, but rather a number of individual equities.
"The uptrend still very much has positive momentum," she said. "With the support of that breadth, or market participation, I think the rally still has legs."
So how high does she see it going?
Stockton said that the S&P 500 is well on its way to 2,250 in the short-term—nearly 7 percent higher than current levels.
