The S&P 500 has topped at 2430 on 6/1/17

The S&P 500 has topped at 2430 or is within 22 points of topping


  • Total voters
    34
I think we are gonna sell hard this afternoon, good luck!

50% retracement tagged.

Screen Shot 2017-06-14 at 14.42.36.png
 
What do you "see"? that others don't? and why that timeframe?

I use bullish percent indicators to tell me when a correction or possible bear market is coming. There are only 4 out of 19 market sectors that are still bullish. Of those, two are defensive sectors, gold and utilities. The other two are healthcare, and basic materials. These are not sectors that can lead us to new highs.

In terms of time frame it is just a guess based on that these negative 15 sectors are a long way from reversing.
 
Last edited:
I use bullish percent indicators to tell me when a correction or possible bear market is coming. There are only 4 out of 19 market sectors that are still bullish. Of those, two are defensive sectors, gold and utilities. The other two are healthcare, and basic materials. These are not sectors that can lead us to new highs.
Thanks, of course my follow up question is how are you determining "bullishness" in only those 4 sectors. Not being a jerk, just trying to understand your view. Thanks,
 
Thanks, of course my follow up question is how are you determining "bullishness" in only those 4 sectors. Not being a jerk, just trying to understand your view. Thanks,

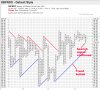
Below is a Point and figure bullish percent chart for the Nasdaq 100. If you don't understand how to read a pnf chart just remember x's are good, and 0's are bad. Pnf charts clear the noise out of the market. Bullish percent indicators tell you what percent of the stocks in the index, market, or sector(in this case index) are currently bullish.(no confirmed signals with 0's passing the last known lows.

This chart shows that while the nasdaq 100 is in a definite bull market, it has now entered a "strongly possible" correction mode. This doesn't help day traders because they trade what they see, but as a swing trader it tells me to stay away from stocks in the index at this time. These bullish percent indicators are available for most indexes, and exchanges. They are all indicating the "time has come" for a correction. Can this reverse back? Sure, but it would take a huge run in all the other sectors to make me bullish at this time. I just don't see what could possibly drive this market further. I am overall bullish, just not at the present time.
 

Attachments

  • Screen Shot 2017-06-14 at 9.50.46 AM.jpg
    Screen Shot 2017-06-14 at 9.50.46 AM.jpg
    304.3 KB · Views: 28
https://en.wikipedia.org/wiki/Confirmation_bias

So we are just about to make new ATH and yet again you are saying 'the top is in'.
I believe the true big money is made by having cojones to step in front of the freight train (with proper size/money management). Picking tops is not swing trading.

I believe the only thing that is holding this market that high (and possibly higher) is the still continuing shift into passive management. So as the money keeps flowing in there will be simple reaction: buy underlying assets. Algos are price agnostic. Notice that a lot people are scratching their heads regarding current prices. Less and less are inclined to buy into this market, but they do so inadvertently by shifting into passive management.

Where that leads? One day/event when enough funds say it's enough what you are going to see is a huge gap down and as little panic ensues, the withdrawals from passive vehicles will fuel selloff further. And instead of having orderly pullback, you may get a mini (or bigger) flash crash because the market will become one sided.
 
Last edited:
Back
Top