AM
When you see this ===== it is a break and transition from one thought/ line of thinking – to another (the next)
But all tying to a central theme (I hope
")
)
==================
Volatility and momentum are not mutually exclusive – and today both were present
======================
The 1st / 2nd & 4th trades were solid entries
The 3rd – not so much
======================
You’re trading what…, 100 shares a pop – did you wonder why the slippage on the 1st trade’s exit – what so special about those 100 over the other 52.5M traded
====================
As you trade – always be asking yourself – why did price go down / not up…. Or up / not down…. Why did price go this far.., but no farther… why did it pull back to this price... but go farther
More on this in a bit
====================
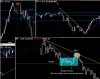
Let’s review the 1st trade
First note – your DTL (pink on my chart) is drawn very sloppily – keep your lines tight (tie the tops / bottoms together) so you can gauge what price is doing in relation to what it has done
Drawn any other way – you are only inducing your subjectivity – stop
So price pushed down (to the first green arrow) started pulling back – forming a small range – and pulled back to the initial TL (the pink one)
Appeared like it was going to respect this TL – but formed an even smaller range – then broke down to a test of the previous low (where you shorted) where it was rejected
Where it breached the 1st (pink) TL
And where you should have exited - and where you should have been alerted 2 bars prior to entering that price was breaching it (be extra cautious)
Let me stress this again – it is important to be anal about drawing your TL ON price’s extremes (now there will be times an outlier will form – but those are just that outliers – let’s stick to the tried and true basics for now
Continuing;
Price then forms a very small bar… then the next bar bursts trough the 2nd (grey) TL – and breaks out the top of the range
Retraces for 1 bar – then resumes up for 1 bar
Fails and puts in a LL – and creates a FBO
===================
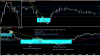
Let’s talk about the mechanics of a FBO
There are 2 auctions occurring simultaneously in any given stock
The straight up auction between the herd (reflected on a chart) – and the reverse auction (what had to happen to create the chart) – where the Herd Masters (HM aka big money) direct the herd
Price moves in direct relation to what the HM need to accomplish
They need to exit a long – they drive price up and off load
They need to enter a short – they drive price up and enter
They need to enter a long – they drive price down and enter
They need to exit a short – they drive price down and off load
And whichever direction they drive it – is the they way the herd is forced to go… and if the herd already in a position – provides liquidity via their stops
HM is the only one capable of starting / stopping / moving price
They are also capable of making price jittery in order to throw off the herd (weak hands)
This game is set up to extract the most money from the most participants
Knowing this may help you decipher what is actually happening, not be taken surprise by it... possibly even exploit it when you see it
Volatile momentum is designed to shake rattle and roll the herd's nerves… and hence their actions into stupid-ness
==========================
I’ll review trade 3 in the next post because I think it contains some food for thought
aside - I hate this need to double post BS
RN