
You are using an out of date browser. It may not display this or other websites correctly.
You should upgrade or use an alternative browser.
You should upgrade or use an alternative browser.
The parabolic move on the Nasdaq is falling and is getting worse
- Thread starter derektrader
- Start date
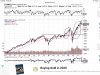

Take a look at this chart. The nasdaq clearly went paraboloc and I think we have downside to the 8500 area.
Seriously, are the "big boys" paying you to post these doomsday scenarios, so they can buy even more from the new short sellers (and scared buyers closing their positions) that your threads will surely create?

Last edited:
So the Naz is going to crash all the way back to...June 2020 levels
Blood on the street!!
Blood on the street!!
So the Naz is going to crash all the way back to...June 2020 levels
Blood on the street!!
What is truly bizarre is that OP won't even follow his own predictions and short the Naz, because... he does not short any market!
Hmmm...


Take a look at this chart. The nasdaq clearly went paraboloc and I think we have downside to the 8500 area.
Why not just plot it logically? If Biden gets elected, he will reverse (and make worse) all things tax-related that Trump implemented. So draw a horizontal line from Nov 2016 across the bottom. There's your new short target. About 5200.
Guys, i dont know where the hell we go from here but the charts tell me much lower. The latest move was much more parabolic than the move prior to february’s down turn.

That's a load of parabolics.Guys, i dont know where the hell we go from here but the charts tell me much lower. The latest move was much more parabolic than the move prior to february’s down turn.
That's a load of parabolics.
I see what you did there. *chuckle*
Last edited:

Take a look at this chart. The nasdaq clearly went paraboloc and I think we have downside to the 8500 area.
That's not even close to what a parabolic move looks like

a sample of a few other gold nuggets by derek"trader"That's a load of parabolics.