thank you guys for the feedback so far.
as a few have asked for my setup, i will share my charts and explain briefly what i am looking at.
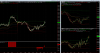
i attached two screenshots.
the first one shows the Micro ES with Advancing-Declining Issues, MNQ and Micro Russel.
the second one shows the Dow Index from a CFD source and 60min MES.
All intraday charts have the VWAP with 1st and 2nd standard deviation, and also high, low and midpoint of current day as moving horizontal lines. those levels are just reference lines, i don't have a trading method to make any trading decisions based on those levels, those are just reference levels.
the Dow charts doesnt have any indicators bc those volume datas are not available from the cfd broker.
i am only trading the MES. what interests me in the other charts are the following:
equity indices derive their price from the underlying stocks. all US indices are created differently,
from different underlying stocks and pricing method, but all tend to show composite results from the underlyings. the S&P includes all Dow stocks and NQ stocks (i didn't really check all individual stock, but the main point is that, if not, at least, the vast majority of those stocks are included in S&P).
NQ shows the technology side. what i like in the Dow is that it shows just 30 stocks, but from different sectors and maybe the most important US companies (some might argue about this point, but the point is that the Dow is representative for the most important (at least from the shear size perspective) US stocks). The Russel shows the broader market, only small caps. what i like in the Russel is:
the larger stocks/companies do not act in a vacuum. the small cap companies are from the business side corraleted with the larger stocks. also small caps are an important part in the economic machine.
i would not expect strong one sided moves in the S&P without the participation of the broader market.
i think at this point an example would be really helpful. if you look at the charts i have uploaded, you will notice the following.
PS: my time is Berlin time -> you need to substract 6 hours to reach NY time
all indices moved in the ON session lower and then bounced . in the cash market open they opened somewhere around the lower midpoint of the ON range.
when the cash market opened (9:30 am NY time) all indices attempted to move higher. after 1h from the cash market open, the AD histogram shows -400, from -200 at the open. NQ and RT make new lows for RTH session, Dow holds above ON high, MES is at RTH low. Despite the -200 difference, RT can holds its ON low, so does NQ. half an hour later AD recovers from -400 to -200.
Dow still holds above ON high, Russel already responded to AD move and MES and NQ just extended RTH low for couple of ticks. if you look at MES and NQ they are holding above -1 std VWAP.
there is no reason at this point of time to attempt any shorts in the MES without any broad market weakness. the NQ is some kind of weak, yes, but not extremely weak, still holding -1 std VWAP and range expansions for a few ticks. so-> breakout plays, or downside momentum plays are off the table.
when NQ is not strong enough, without the participation of technology i would not attempt any trend day type moves to the upside either. Obviously there is potential for small recovery for the MES, though. in that scenario the best play, given the information from the other markets, is to go long at RTH low in the MES, with target around day's mitpoint and stop around ON low. that would already be sufficient for at least 2R to 3R.
could it happen that technology recovers intraday and all markets tend to move higher simultaniously? absolutely. impossible is nothing. if i would trade multiple lots, i would trade
differently, obviously. taking off my first lot at midpoint and risking the other lot for a potential move higher would be ideal, as you can see technology revovers in the afternoon, Dow trending higher and no reasonable weakness in the Russel. -> MES trends higher.
so, hopefully, i could explain what my type of intraday analysis looks like.
i also, first thing before trading, make a top down analysis for each contract and mark important levels for each market. later, i can also share other parts of my analysis.
Kind regards
")