
You are using an out of date browser. It may not display this or other websites correctly.
You should upgrade or use an alternative browser.
You should upgrade or use an alternative browser.
The Credit Crisis Financial Stocks Short Journal
- Thread starter Daal
- Start date
Breadth data. One needs to be careful with NYSE data because it includes lots of non-stock securities such as bond ETFs, CEFs, etc
http://stockcharts.com/scripts/php/candleglance.php?$NYAD,$NYHL,$NAAD,$NAHL,$AMAD,$AMHL
Nasdaq and AMEX all confirm the rally. Breadth still strong so if history is any guide this market has more room to go
http://stockcharts.com/scripts/php/candleglance.php?$NYAD,$NYHL,$NAAD,$NAHL,$AMAD,$AMHL
Nasdaq and AMEX all confirm the rally. Breadth still strong so if history is any guide this market has more room to go
Am I assuming too much to say this breadth study 'contribution' I made by posting this stuff, is probably the biggest contribution made on ET for the entire month of Oct?I mean people waste their time bitching about the government all day and how they are up $X doing this or that, what about actual stuff that makes money?Had I known about this before it would saved me quite a bit of money, yet I never heard a single person say 'dude, breadth is strong, this market is going to go up some more'
That's good stuff from Desmond. To summarize: at market index tops, very few stocks in the big averages are making new highs, and many have already rolled over, some significantly.
Now I would be interested in how often this setup gives a false signal. In other words, lets look at this from the reverse. If we observe a day or period w/few stocks making new highs and many stocks significantly off their highs, what do the averages look like 30 days later, 3 months later, 6 months later, 1 year later.
Now I would be interested in how often this setup gives a false signal. In other words, lets look at this from the reverse. If we observe a day or period w/few stocks making new highs and many stocks significantly off their highs, what do the averages look like 30 days later, 3 months later, 6 months later, 1 year later.

Quote from ralph00:
That's good stuff from Desmond. To summarize: at market index tops, very few stocks in the big averages are making new highs, and many have already rolled over, some significantly.
Actually its all NYSE issues not the big averages
Now I would be interested in how often this setup gives a false signal. In other words, lets look at this from the reverse. If we observe a day or period w/few stocks making new highs and many stocks significantly off their highs, what do the averages look like 30 days later, 3 months later, 6 months later, 1 year later.
I havent saw a study of this kind. One problem with this bread analysis for the current rally is that it depends what do you call the current rally. If its a recession type bounce, its overextended
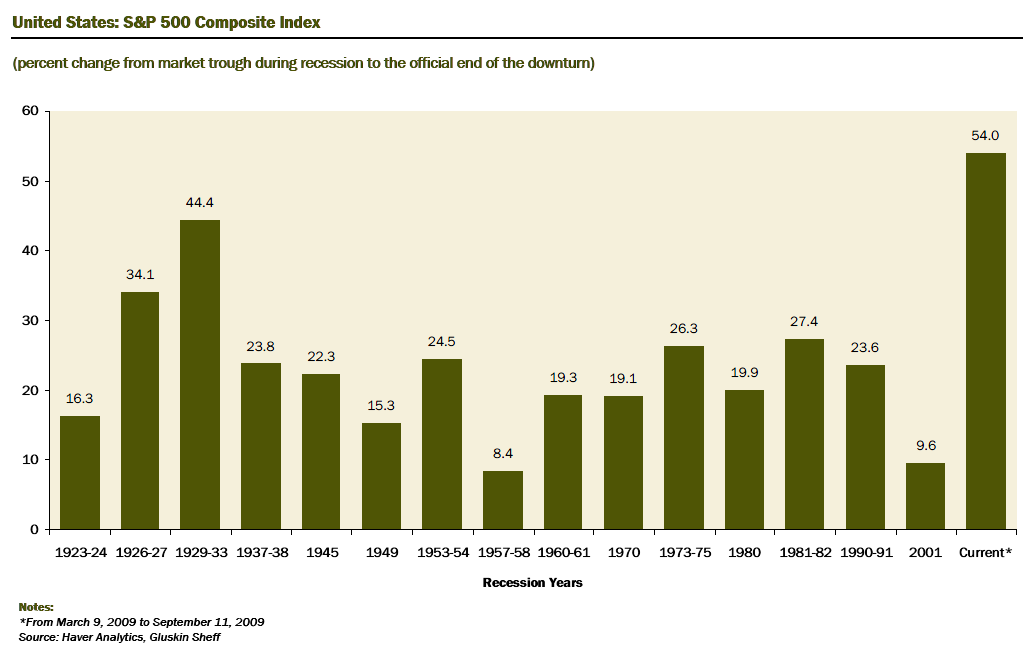
If you call it a major rally, of the bull market types that topped in 2007, 2000, 1990, 1987, 1980, 1976, 1973 etc(those are all the tops the research I looked shows using S&P data) then the breadth analysis probably apply more and it might have further to go. I wish there was a study of the breadth data for that gluskin sheff rallies
In any event, I'm rather be cautious till the market losses its breadth support. Then I'm shorting big time
Looks like that alternative measures of inflation(which have better track record of predicting future inflation than the BLS CPI) are showing even stronger disinflationary trends
http://blogs.wsj.com/economics/2009/10/15/cleveland-fed-draws-up-ways-to-measure-inflation-trends/
http://www.clevelandfed.org/Research/data/US-Inflation/mcpi.cfm?DCS.nav=Local
http://blogs.wsj.com/economics/2009/10/15/cleveland-fed-draws-up-ways-to-measure-inflation-trends/
http://www.clevelandfed.org/Research/data/US-Inflation/mcpi.cfm?DCS.nav=Local
More on alternative measures of inflation created by the fed
http://news.goldseek.com/MillenniumWaveAdvisors/1159714860.php
http://www.dallasfed.org/data/pce/index.html
Trimmed mean PCE yoy in aug was 1.6%. Trimmed mean PCE is essentially PCE without the elements rising and failling the most, inflation ex-volatile items instead of inflation ex-food and energy. It makes quite a bit of sense if you think about it
http://news.goldseek.com/MillenniumWaveAdvisors/1159714860.php
http://www.dallasfed.org/data/pce/index.html
Trimmed mean PCE yoy in aug was 1.6%. Trimmed mean PCE is essentially PCE without the elements rising and failling the most, inflation ex-volatile items instead of inflation ex-food and energy. It makes quite a bit of sense if you think about it
Looks like I wasnt the only one who got caught in the 'idiot' rally of 2009
http://www.businessinsider.com/the-idiot-maker-rally-2009-10
Apparently most who predicted the crisis got caught, it seems to me that is was the rational thing to do, to believe the crisis of confidence would not end and that would keep risk appetite down and the economy depressed, that the negative feedback cycle would continue. Turns out that was wrong, the immaculate recovery took over and out of nowhere confidence came back
Now Greenspan is saying the dramatic rise in corporate bonds will provide a large stimulus for the ecomony, as borrowing capacity in the IG and junk market is dramatically higher(it was inexistent in Q1) and interest payments much lower
Lesson: Since human sentiment defines such a large % of the final outcome in a market economy, one can never rule out any possibility, that is because if people collectively start to believe in the almost impossible, it will became more possible
http://www.businessinsider.com/the-idiot-maker-rally-2009-10
Apparently most who predicted the crisis got caught, it seems to me that is was the rational thing to do, to believe the crisis of confidence would not end and that would keep risk appetite down and the economy depressed, that the negative feedback cycle would continue. Turns out that was wrong, the immaculate recovery took over and out of nowhere confidence came back
Now Greenspan is saying the dramatic rise in corporate bonds will provide a large stimulus for the ecomony, as borrowing capacity in the IG and junk market is dramatically higher(it was inexistent in Q1) and interest payments much lower
Lesson: Since human sentiment defines such a large % of the final outcome in a market economy, one can never rule out any possibility, that is because if people collectively start to believe in the almost impossible, it will became more possible
Geithner QE
U.S. Treasury, supplementary financing account 99,967 -29,989 w-w
And if I'm reading this right, excess reserves went up $22b(since required reserves are fixed)
Reserve balances with Federal Reserve Banks 981,619 + 22,755
So the fed sits idle by while Geithner pumps base into the banks, meanwhile they continue to buy assets. Does this fed look hawkish?
U.S. Treasury, supplementary financing account 99,967 -29,989 w-w
And if I'm reading this right, excess reserves went up $22b(since required reserves are fixed)
Reserve balances with Federal Reserve Banks 981,619 + 22,755
So the fed sits idle by while Geithner pumps base into the banks, meanwhile they continue to buy assets. Does this fed look hawkish?