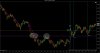
Only 1 trade today.
I lost interest after it but kept watching the charts.
Gabe
From a pure technical price action point of view, why did price find support where it did at 9:47am and 10:53am?
Only 1 trade today.
I lost interest after it but kept watching the charts.
Gabe
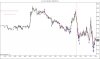
The only thing I see are the peaks and troughs that I have circled but if you would not have mentioned those 2 times, I don't think I would have found the circled areas of significance.From a pure technical price action point of view, why did price find support where it did at 9:47am and 10:53am?
From a pure technical price action point of view, why did price find support where it did at 9:47am and 10:53am?
")
Maybe this is a better reason
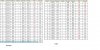
3rd day with my random entry system on CL today. Wish me LUCK!
(Pic is actually yesterday and the day before. 3rd and 4th of feb)

I stopped after 500 consecutive tails.