yep i know everythingMaybe this is your problem you want to know a little of everything and not a lot of one thing.
“Chase two rabbits catch none”

yep i know everythingMaybe this is your problem you want to know a little of everything and not a lot of one thing.
“Chase two rabbits catch none”
yes i started using BB and they have made me profitableJohn's a good guy. He maintains a private email discussion group for those interested in Bands. You can ping him if interested in participating.
i agree they made me profitable stopped me overtrading and so 90% of my losses have stopped helped me stop placementThe utility of *any* technical indicator depends on
1) the constancy of the market, with respect to history [the market-lagging inputs]
2) the intention of the indicator to draw attention to trend or to trend-breaks (as in, BBs)
3) the look-back parameters (which 90% of traders leave as God-given and fixed)
4) how the indicator is used: whether as an auto-trading trigger or for discretionary support.
That said, "Are Bollinger Bands any good?" Yes.
you mean john999 or?John's a good guy. He maintains a private email discussion group for those interested in Bands. You can ping him if interested in participating.
what are you talking about?Yes....they are useful. Here are a few scenarios.
With daily data, previous month was a 12 month high.
Daily close is below the lower Bollinger band.
There is a strong probability that the previous high will be tested.
Another:
With daily data, previous month was a 12 month low and was below lower Bollinger band.
The prior two weeks were down.
Todays close is up big.
There is a strong probability that there will be a good sized bounce before further selling.
unfortunately we have the BB onlyBollinger Bands are good for identifying volatility squeezes under certain circumstances. However, if using them for trend or swing trading, there are challenges. Because BB is based on an average and the volatility around that average, when price takes off from a stable condition the volatility expands because the average is not tracking the price action. Thus, the bands widen and price "walks the band". I wanted something that tracked price action and reflected the volatility around the movement, not the lagging average, With that in mind, developed then later published an indicator based on regression "Standard Error Bands" in 1996. Due to certain restraints at the time, I was required to give it such an ugly descriptive name and changed it since but not published differently (yet).
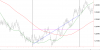
Check out the image to see how the average vs regression tracks price movement differently between the vertical lines. The green line is the moving regression value and red line is the moving average. The magenta horizontal line is the average looking back from the vertical line on the right and blue line is the regression line evaluating the same data. Notice that the average is horizontal, thus price action moving away from the average simply causes volatility to increase but does not reflect direction. Conversely, regression tracks direction AND volatility. Cheers!
What platform are you using? Depending on what it is I will share. You can also Google "Standard error bands" (icky name though)unfortunately we have the BB only
what is regression though it sounds familiar
oh you too are drinking..Cheers
mt4What platform are you using? Depending on what it is I will share. You can also Google "Standard error bands" (icky name though)
Only drinks for me are sparkling water lol. Cheers!