Well it’s Sunday and I’m buzzing from playing music tonight. So …. I’ll spare you my market comments and mutual fund allocation recommendations that I sent my beta testers earlier today : ) but provide a few of the attachments. (Who knows, someone might like it.)
Of short note:
On the first attachment, one BT told me to lose the Calibri and go to Arial. (So I did a little web search and Arial is top dog. There’s also various stories how Arial was basically thugged from Helvetica.) Anyway, I'm changing things to Arial.
Another person suggested that I lose one of the year returns (2013) and add a column in the weekly area that provides percentage return for the last four weeks. I might give that a go.
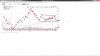
The 2nd attachment is Market Type and Volatility for the last 25, 50, 100 and 200 days of the SP-500. You can see that everything is Strong Bull.
The 3rd and 4th attachments are the Indices and Sector Market Type and Volatility that follow the same order as the first attachment. This is just showing the last 100 days, which is the major guide in our mutual fund timing. You can see some interesting goings on.
The last attachment is some stats on Market Type and Volatility from 1962 to last Friday. Do look at Figure 4 and specifically the number of days in Strong Bull/Quiet and Bull/Quiet and their respective average daily returns.
Lastly, if you’re not familiar with Van Tharp’s Market Type, here’s a short overview.
")