You are using an out of date browser. It may not display this or other websites correctly.
You should upgrade or use an alternative browser.
You should upgrade or use an alternative browser.
The ACD Method
- Thread starter sbrowne126
- Start date
....For the past 3 and a half years there is a 75% chance that the SPY will not close inside the 20 Minute Opening Range...
The only problem with that is that on 30% of those 75% of days, the SPY will not close on the same side of the OR that it initially broke out on, so knowing when to get out becomes imperative.
")
It's been my experience that sometimes you can make a lot of money intraday trading simple OR breakouts....times when the volatility is high in instruments like /CL, /VX, /UB, /NKD, USD/CAD, come to mind....however, when the volatility dries up, you will get chopped.
In my opinion ACD functions best when added to what already works for you when intraday trading. I lost money trading off 30-minute bars taking simple breakouts...switched to 5-minute bars and started looking for patterns within the opening range in conjunction with ACD and things have gotten better.
I've found the first (4) 5-min bars of the day contain a ton of information once I started getting familiar with what to look after watching the screen day after day after day. Just my two cents.
I have better results with a tick chart rather than any time based charting. I use the time based charting just to get my levels from ACD. I then use non-time based charts to trade around those levels. Time based charts can get you chopped up. I use a variable tick chart based on volatility. A time based chart is always the same length of time regardless of volatility. 5 Minutes will always be 5 Minutes.
I threw those stats out there because I now believe it is better to fade failed A's around the Opening Range rather than around the A level itself. You will get chopped up trying to fade around any A levels.
I already backtested the OR direction to see if it carries on in the initial direction and it is nothing more than a coin flip 50/50...no edge.
The stats I shared support the following scenario:
"I have a positive Number Line and the OR is at 31%. I just saw a Failed A Down with price now back inside the opening range.I know that 75% of the time that price will not settle inside the opening range so I now have some very good reasons to fade the downside and get long".
I'm still fairly new to learning the ACD Method. I know one of my main complaints is that the stops are too wide. In that video online Mark talks about setting his stops then going to watch a movie or getting some donuts. He actually made fun of people for watching every tick in the market.
I'm able to get really tight stops with a tick chart, if you try to use a one minute chart then you will get chopped to shreds.
One last thing, the NL might be saying that there will be a sell off on Monday in the ES.
Last edited:
I have better results with a tick chart rather than any time based charting. I use the time based charting just to get my levels from ACD. I then use non-time based charts to trade around those levels. Time based charts can get you chopped up. I use a variable tick chart based on volatility. A time based chart is always the same length of time regardless of volatility. 5 Minutes will always be 5 Minutes.
I threw those stats out there because I now believe it is better to fade failed A's around the Opening Range rather than around the A level itself. You will get chopped up trying to fade around any A levels.
I already backtested the OR direction to see if it carries on in the initial direction and it is nothing more than a coin flip 50/50...no edge.
The stats I shared support the following scenario:
"I have a positive Number Line and the OR is at 31%. I just saw a Failed A Down with price now back inside the opening range.I know that 75% of the time that price will not settle inside the opening range so I now have some very good reasons to fade the downside and get long".
I'm still fairly new to learning the ACD Method. I know one of my main complaints is that the stops are too wide. In that video online Mark talks about setting his stops then going to watch a movie or getting some donuts. He actually made fun of people for watching every tick in the market.
I'm able to get really tight stops with a tick chart, if you try to use a one minute chart then you will get chopped to shreds.
One last thing, the NL might be saying that there will be a sell off on Monday in the ES.
My previous post is not totally accurate, you can get chopped with tick charts as well, it just feels as if you have a little more precision VS. a one minute or 5 minute chart. I can't prove what I am saying with stats. I don't mean to get off track here or over post on this thread. My original motivation for bringing it up was to find out better alternatives to how Mark Fisher sets wide stops.
My previous post is not totally accurate, you can get chopped with tick charts as well, it just feels as if you have a little more precision VS. a one minute or 5 minute chart. I can't prove what I am saying with stats. I don't mean to get off track here or over post on this thread. My original motivation for bringing it up was to find out better alternatives to how Mark Fisher sets wide stops.
With regards to stops , do some research into time stops (Mark alludes to them i think in his seminar also Mav discusses them in this thread also).Best to use both but that's just my opinion.
Anyone noticed the really right range with this ATH
You have a private message.
Thanks
I just hope we get a nice sell off on Monday in the ES. The Number Line will remain negative for the next 3 or 4 days unless some actual upside levels are put in/confirmed. The great thing about the NL right now is it will keep you on the sidelines waiting to get short. If I didn't have the NL or the ACD Method then there is a much better chance I would be getting chopped up on the long side right now. I'm done preaching to the choir, I'm an NL believer!I gotta go get some pop corn for this one!
I just hope we get a nice sell off on Monday in the ES. The Number Line will remain negative for the next 3 or 4 days unless some actual upside levels are put in/confirmed. The great thing about the NL right now is it will keep you on the sidelines waiting to get short. If I didn't have the NL or the ACD Method then there is a much better chance I would be getting chopped up on the long side right now. I'm done preaching to the choir, I'm an NL believer!I gotta go get some pop corn for this one!
You should really try to stop yourself imposing arbitrary judgements such as "The great thing about the NL right now is it will keep you on the sidelines waiting to get short". Moreover you should approach the start your trading week with an open, unbiased mindset. ACD will tell you which direction to trade in whenever that may occur.
With regard to the ES I am more or less sidelined right now but I am still carrying a few longterm, long SPY positions. All I have done of late is move stops slightly closer, as I am unable to know what will happen next... Even looking outside of ACD land we have seen the broad indexes breaking new highs amongst very mixed, sceptical sentiment, which to me is a pretty bullish at least on the timeframes I am watching.
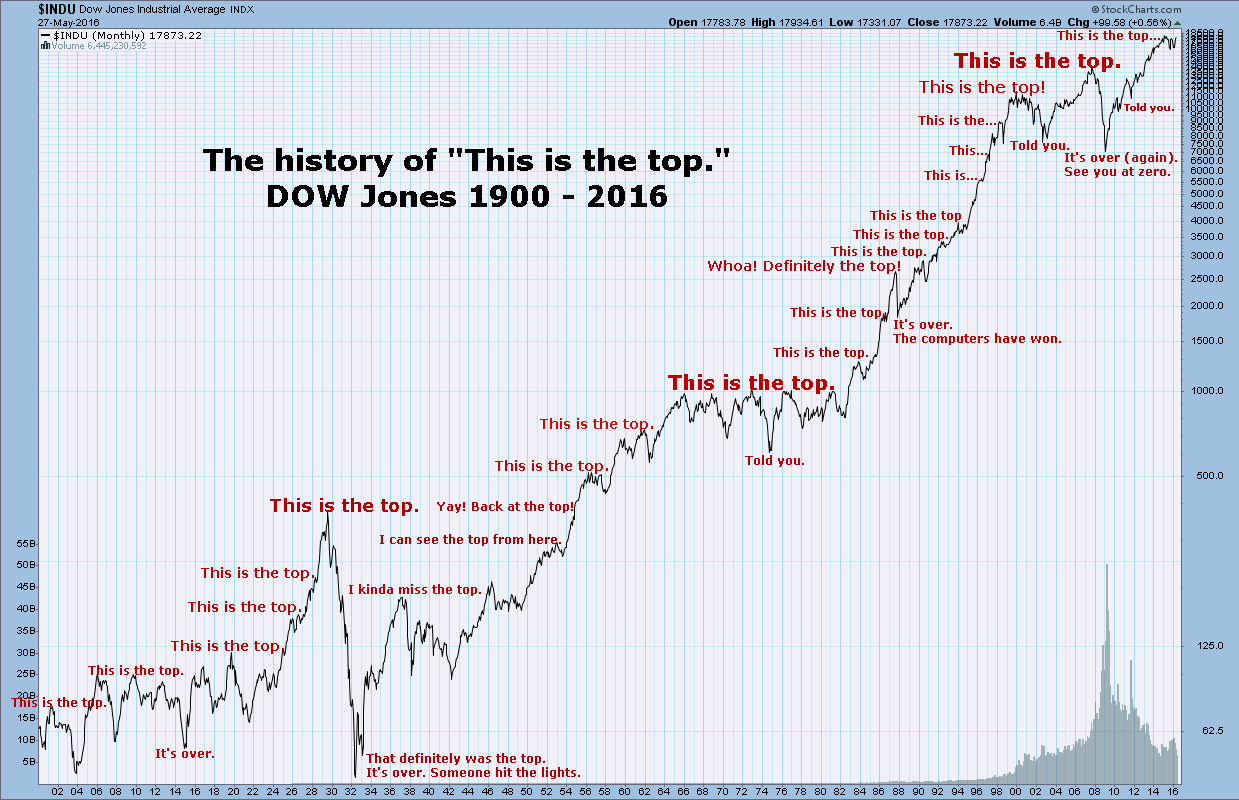
You might like the attached cart
 ...
...
I'm an intraday trader, I don't care about calling tops. I'm just looking for a nice one day sell off. I like that the NL is keeping me from participating in this bad price action on the long side. While I have you here, what is your expert opinion for today? Up or Down?