The ACD Method

The Homegamer's Number Lines for Retirement Mutual Fund Timing : )

Hello HomeGamer’s,

We’ve had a few recent 30 day confirms and I've added some of them to my MF’s. I've had enough Instant Gratification to keep me in the likes of IJK, IJT and IVE. (I give my Instant Gratification 3 to 5 days for MF’s.)

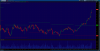
We do have a few notable System Failure confirmations and XLI is a real interesting one. It confirmed negative on 8/1/14 and then had a good System Failure including bouncing off the Weekly A down on the 6th and then making a weekly A Up on the 8th. I thought “The perfect mutual fund system failure trade” and then did nothing! It is interesting that’s XLI is up like this but the 30 day continues to be strongly negative. Something has to give.
 

Attachments

Break out of what? OK maybe break out of the 81.5 resist. But this occurred on 10.08. with an up gap already.
The daily chart shows how the latest up move has to be integrated or interpreted according to the big picture and what could the possible bullish consequence (opportunity) be.

There has been a final test of the multi-support level around 79 which lead to an impulse start on 8th of May. As said before on 10th of August the resist level around 81.5 has been conquered.

On hourly chart it could be seen that the resist level has been tested a number of times which reflects the importance of the zone which lead to a gap up break out. Goodmann would possibly speculate on a break out of the big triangle focusing a target at 89.8. The upper boundary line is at 85.01 actually but prior to that line there are two further resist areas around 83.4 and 84.5.

The hourly chart below shows a EW count since the positive test of the multi-support zone around 79.2.
An absolute requirement for a further up move is an affirmation that there is an impulse running. Which means that the up move has to reach the extension level 83.2 before breaking the lowest blue trend line and in best case before breaking the lowest black and second lowest blue trend line. This gives us the confirmation that a bigger impulse on a higher degree is up folding. If so we can say yes there will be a chance for a bigger break out.


Hmm..
 

Attachments

  • 2014-09-08-TOS_CHARTS(dx).png
    2014-09-08-TOS_CHARTS(dx).png
    54.2 KB · Views: 95
The extension level at 83.2 has been reached, so we can say that a larger impulse wave is up folding. Resist level at 83.4 has been tested positively. Good signs for the Goodman scenario.

Now an important decision point has been reached the resist level 84.5. The upper triangle line is actually at 84.99. Maybe we will see a minor correction at this point.
A closer look at the impulse substructure is showing steadily increasing dynamic showing trend lines with increasing slopes.
What should also be mentioned is a" bomb" occurring at the last trend line. A bomb is defined as a short violation of the trend line “false break” followed by an impulsive break out in form of a gap up break out. That is a typical feature for a running wave iii of 3.


Furthermore the situation EUR/US is indicating a further decline min. 27875. But we could see more downside retracement into the next year. That is because EUR/US completed an EDT formation as a consequence an total retracement of the last formation has to be expected.
Overall there is confirmation that the Goodman scenario is running already.
 
The extension level at 83.2 has been reached, so we can say that a larger impulse wave is up folding. Resist level at 83.4 has been tested positively. Good signs for the Goodman scenario.

Now an important decision point has been reached the resist level 84.5. The upper triangle line is actually at 84.99. Maybe we will see a minor correction at this point.
A closer look at the impulse substructure is showing steadily increasing dynamic showing trend lines with increasing slopes.
What should also be mentioned is a" bomb" occurring at the last trend line. A bomb is defined as a short violation of the trend line “false break” followed by an impulsive break out in form of a gap up break out. That is a typical feature for a running wave iii of 3.
[/URL
]

Furthermore the situation EUR/US is indicating a further decline min. 27875. But we could see more downside retracement into the next year. That is because EUR/US completed an EDT formation as a consequence an total retracement of the last formation has to be expected.
Overall there is confirmation that the Goodman scenario is running already.

huh?
 
There are three possible directions, but ok not so important.
All the lines have a meaning in the sense of degree.” If then” statements are a logical operator which gives a clear specification.
Maybe it is more about what could be explained with the sentence: “Think small big ideas upset everyone.”
But I do not think that someone including myself have an interest in discussing the difference between utilitarianism and constructivism really.
Obviously this thread has another intention as supposed by me. Therefore I will disclaim for further statement in this forum.
 
Back
Top