You are using an out of date browser. It may not display this or other websites correctly.
You should upgrade or use an alternative browser.
You should upgrade or use an alternative browser.
The ACD Method
- Thread starter sbrowne126
- Start date
Quote from Maverick74:
What are the W1, W2 and W3 levels? Are those different contract months?
W1-14 is week 1 of 2014. I named them W1-14, Q1-14 etc for ease of reference with my trading buddies. I quit trying to analyze back months for A levels based on what you said in response to my question about back months.
Maverick.
I ordered Fisher's "The Logical Trader" other your great threads any other resources? Really interested in adding this to my repetiore.
this may be useful to you dated but still relevant:
http://vimeo.com/15967639
Mav, thoughts on XAG/AUD?
Silver is forming a base with a strong number line, Aussie is weak.
Silver is forming a base with a strong number line, Aussie is weak.
Per Mark Fisherâs NYMEX 3rd video at the approximate 38:20 area is a discussion about the 5 day rolling outside reversal up pattern.
As you know, the conventional 2 bar outside day has H>H1 and today's low is less than yesterday. For the âUpâ pattern they often add todayâs close is greater than yesterdayâs close. I created a scan with the close greater than $5; 21 days average volume greater than 100,000 and the current 5 day pattern being an outside reversal up pattern against the 5 previous days. (I also created a 5 day outside reversal down pattern.)
When you look back over the signals and compare them to the monthly A ups/downs there are some interesting results. Youâll note they often occur by completing an A up, or piercing and closing above the A level or start that strength/weakness building at the A levels. Remember Mavâs recent words: âBTW, let me add something here. About stocks basing, I have no problem with a stock forming a base, but I want that base to either be along a monthly A up or after it made a monthly A up. In other words, I want the base to be in a position of strength.â
Yesterday, ELY made an A Up in the 8.80 area; GSK made an A Up in the 53.50 area; MS made an A Up in the 32.10 area; MXWL made an A Up in the 8.20 area and STAG made an Mo A Up in the 21 area. (These are all monthly A ups.)
If anyone cares to see the results from yesterdayâs scan:
BCF CNTY CRY CTCT DY EA EFX ELY ESNT ETN EVR EXL FLR GLNG GSK GSM GWRE H IBM JBL KFX MED MS MSCI MXWL NTAP NXPI OZRK PGH PHO QCOM SBCF SEIC SFL SLRC STAG STML TRW V VITC WYN XLNX YUME
In the event someone might have an interest. I've completed a few backtests of the 5 day rolling outside reversal up and relevant points are:
>Not that much difference in results between the last bar just being a) a higher high than the previous 9 bars or b) the last bar being both a higher high and higher close. Results are a bit better if the close is higher and, it just looks better. : ) So, thatâs my nightly scan.
>I ran various time frames on a number of indexes and results were similar across the board. As an example, the last two years of the SP-500 had approximately 4,000 setups. If I took every trade at the next morning open, and held for 3 days, 5 days etc, the results were basically 50/50.
>If however I changed the entry so you entered on strength above the setup bar (% of ATR above) with a 5 day hold, then trades dropped to 2,252 and winners are 52% (see attached). Also, this isnât about a mechanical system for me. This just provides many past examples that I can look at attempting to understand Mavâs description of price action. And, it's good to know that in all backtests, if you are looking to buy on strength after this pattern appears, it's always winning a bit above 50%. Now add some price action discretion (big talk for an ACD newbe).
>Each trade is shown on the first tab. So, if one wants to they can see the entry date of every trade and all the trade info. Then, look at the chart, see the pattern and compare it to the various A levels, the market, sector, news etc. Iâm paying particular attention to the monthly and quarterly. I see some things that I think will help in my discretionary go donât go decision process.
>An interesting note was the two year run from 12/8/2008 to 12/1/2010 had 2106 setups and 55% winners. I didnât think it would be that good during that time. (If anyone wants the ss Iâll post it.)
Tonight, from Wordenâs list of 7,408 stocks, there were 25 meeting the 5 day rolling outside reversal up pattern with close above $5 and 21 day average volume above 100,000, as follows:
ABX, AMBC, BBCN, BBRY BMA, BUSE CUBF, EA, EQU, EVTC, EXC FFIN, GERN, GG, GGN, INFI, MIL, NBB, OKS, OSIR, PNFP, VLY, WAL, XCO
(Note: I can't download the ss here. Perhaps it's too large. I'll try google ss:
https://docs.google.com/spreadsheet/ccc?key=0Al3xyUcZI_cMdDRZWkhJQkFWSklTQ3VNZWVEYVc3VlE&usp=sharing
Can't see the reason why one would use ACD for stocks, except on rare occasions
IF one has strong conviction, the return on capital would be far greater using futures/FX/options (leveraged instruments) than stocks
IF one has strong conviction, the return on capital would be far greater using futures/FX/options (leveraged instruments) than stocks
Hello guys,
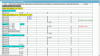
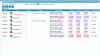
I was reading this thread for quite some time now and want to thank all guys contributing and especially Maverick of course") Now I'm interested if anyone looked at Livermore market key system. It looks like it and ACD are especially fit to be used together. Livermore was talking a looot about time element, but his system was basically just a method to keep records and he probably used time element subconsciously due to his huge experience in markets (that's why he did not recommend tracking too much stocks, because you need to get a feel for each one, similar to what Maverick is saying). However combining ACD and this record keeping system gives more structure to viewing markets and I think its possible to follow much more products that way. After reading this thread I understand that Maverick is against combining a lot of systems/indicators together to not use too much stuff and get lost (which I totally agree with). But Livermore market key is different in my opinion. I don't see it as a system per se, but more as a way to view the market and keep records of prices. Thus it is not adding something additionally, but quite contrary - it filters a lot of noise. So its not making everything more complex, but more simple. Moreover similarly to ACD you can fine tune it to your style/time frame by choosing price distance that constitutes natural rally/reaction. Anyway I'm interested if anyone experimented with that and if you care to share your experiences. I'm currently working on application for myself which will help automate ACD calculations and keeps records Livermore style and currently it looks something like that (see attachments, its work in progress though).
Now I'm interested if anyone looked at Livermore market key system. It looks like it and ACD are especially fit to be used together. Livermore was talking a looot about time element, but his system was basically just a method to keep records and he probably used time element subconsciously due to his huge experience in markets (that's why he did not recommend tracking too much stocks, because you need to get a feel for each one, similar to what Maverick is saying). However combining ACD and this record keeping system gives more structure to viewing markets and I think its possible to follow much more products that way. After reading this thread I understand that Maverick is against combining a lot of systems/indicators together to not use too much stuff and get lost (which I totally agree with). But Livermore market key is different in my opinion. I don't see it as a system per se, but more as a way to view the market and keep records of prices. Thus it is not adding something additionally, but quite contrary - it filters a lot of noise. So its not making everything more complex, but more simple. Moreover similarly to ACD you can fine tune it to your style/time frame by choosing price distance that constitutes natural rally/reaction. Anyway I'm interested if anyone experimented with that and if you care to share your experiences. I'm currently working on application for myself which will help automate ACD calculations and keeps records Livermore style and currently it looks something like that (see attachments, its work in progress though).
I was reading this thread for quite some time now and want to thank all guys contributing and especially Maverick of course
Now I'm interested if anyone looked at Livermore market key system. It looks like it and ACD are especially fit to be used together. Livermore was talking a looot about time element, but his system was basically just a method to keep records and he probably used time element subconsciously due to his huge experience in markets (that's why he did not recommend tracking too much stocks, because you need to get a feel for each one, similar to what Maverick is saying). However combining ACD and this record keeping system gives more structure to viewing markets and I think its possible to follow much more products that way. After reading this thread I understand that Maverick is against combining a lot of systems/indicators together to not use too much stuff and get lost (which I totally agree with). But Livermore market key is different in my opinion. I don't see it as a system per se, but more as a way to view the market and keep records of prices. Thus it is not adding something additionally, but quite contrary - it filters a lot of noise. So its not making everything more complex, but more simple. Moreover similarly to ACD you can fine tune it to your style/time frame by choosing price distance that constitutes natural rally/reaction. Anyway I'm interested if anyone experimented with that and if you care to share your experiences. I'm currently working on application for myself which will help automate ACD calculations and keeps records Livermore style and currently it looks something like that (see attachments, its work in progress though).Attachments
Can't see the reason why one would use ACD for stocks, except on rare occasions
IF one has strong conviction, the return on capital would be far greater using futures/FX/options (leveraged instruments) than stocks
IMHO why not. There can be different reasons for different people. Leverage is two sided sword, maybe someone is very risk averse. Also maybe someone is comfortable analyzing stocks and like that there are lots of opportunities. For example if you expect market turn, why go long index when you can go long individual stocks that showed strength in the weak market. Besides you can express trade with options if you want (I think you still need to follow underlying stock for that if you want to grasp its future direction). Or maybe someone is good at analyzing sectors and relationships and that king of bottom up approach could have predictive power for broader markets etc...
Can't see the reason why one would use ACD for stocks, except on rare occasions
IF one has strong conviction, the return on capital would be far greater using futures/FX/options (leveraged instruments) than stocks
Each product has their own pros and cons. Stocks are probably the BEST product to use but require by far the MOST amount of work. If you are willing to track 100's of number lines, you can find some amazing gems. You can use options for leverage if you want. I buy DITM calls on many trades. But again, you have to be aware of the limitations of each product. There are negatives as well for stocks. So there is always a tradeoff.