Regarding all the programming stuff, I found openpyxl to be very useful. It helps you to work with excel files in python. I don't trust any of my code so I like to verify each step visually in excel and this library made it pretty simple.
You are using an out of date browser. It may not display this or other websites correctly.
You should upgrade or use an alternative browser.
You should upgrade or use an alternative browser.
The ACD Method
- Thread starter sbrowne126
- Start date
Thanks for the reply.
I have looked at the 5 day change but it seems to move around too much. I can't find a signal in there. The 5 day has a mean-reverting quality to it, so if it's been strong then it's probably due to quiet down. A +10 can quickly revert back to a 0 just from normal mean reversion and not imply any weakness. A +4 score can become a -6 on a pullback and then bounce right back. It seems like a lot of noise to me.
Interested in what others think...
yes, it is the weekly level. But, my question was does it have potential to be an effective OR ?Sounds kind of like a weekly level. Why not just use that? I think its great to try out new ideas like that though.
yes, it is the weekly level. But, my question was does it have potential to be an effective OR ?
I guess it just depends on how you want to use it. As long as you understand what the level represents...I personally haven't really found much use for the levels. I am going pretty much entirely off NLs. I keep the levels on my charts and am always brainstorming ideas but I haven't found a clear use for them yet.
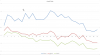
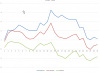
Here are some interesting charts for you guys. For each chart the x axis is time in days and the y axis is % return. The return is the average for going long and short the top and bottom x # of stocks from the sp500. Series 1 top/bottom 10, series 2 top/bottom 30, series 3 top/bottom 100. The rankings are made with a momentum based number line indicator. I chose a random day, sorted it and ran the results. I've done a bunch of random days and they all look pretty similar. Results are based on buying at the open price the day after the sorting, and % return is cumulative each day based off the closing price that day. The first is the very fast indicator.
Attachments
")
I've scanned (not read in depth) Fisher's book and came away thinking that to use ACD successfully would require his proprietary calculations. When I read your posts I get a different take on that. Given the book and your posts seem (possibly) to conflict I come away thinking hmmmmmm .... how would I go about drawing the correct number lines on a chart of say Corn or AAPL - daily or weekly time frame? Is it feasible to accurately apply ACD to a given chart without Fisher's proprietary calculations?Once you start using number lines you won't ever have to look at a chart ever again. I think the beauty of number lines is that it's more data driven and lends itself well to statistical analysis. The number lines contain information that you won't see in the chart. A chart is like looking at a car on the outside and trying to diagnose what is wrong with it. The number lines is like reading the code off the internal chip in the car's computer that tells you exactly what is wrong with it. Sure, eventually whatever is ailing the car will show up in the form of smoke coming out from under the hood or the engine just stopping. The idea is to find the problem before that happens and that is what number lines do.
I've scanned (not read in depth) Fisher's book and came away thinking that to use ACD successfully would require his proprietary calculations. When I read your posts I get a different take on that. Given the book and your posts seem (possibly) to conflict I come away thinking hmmmmmm .... how would I go about drawing the correct number lines on a chart of say Corn or AAPL - daily or weekly time frame? Is it feasible to accurately apply ACD to a given chart without Fisher's proprietary calculations?
I think you're looking for a black box strategy...if A then B (enter)...which ACD is not. I think many people who come here...they're all looking for that...kinda straight forward strategy where if A happens...just do B....and in today's HFT environment...these blackbox strategies are probably the low hanging fruit and there's probably no longer any edge.
Am not looking for a black box to spit out trades such as "Enter at X, exit at Y, etc". Am just trying to understand re ACD if a) the lines can be draw without Fisher's proprietary calculations (I somewhat assume they can be) and b) if they can be draw w/o Fishers proprietary calculations how to correctly go about it. If there is no "correct" way then that's OK too - am just trying to understand if that's the case and if it is then that implies that there's a bit of art to their calculation ... which is OK too. Just trying to narrow down what I know and don't know.I think you're looking for a black box strategy...if A then B (enter)...which ACD is not. I think many people who come here...they're all looking for that...kinda straight forward strategy where if A happens...just do B....and in today's HFT environment...these blackbox strategies are probably the low hanging fruit and there's probably no longer any edge.