And last but not least, we have the full enchilada. Once again, front month prices are sorted from low to high and you see the corresponding price in HJ. This time note we are graphing the actual price of HJ and not the daily change. So you can see how at low prices of nat gas between say 2.25 and 3.00 HJ is relatively flat and stable meaning one can own HJ between .15 and .20 and not lose much money even if front month futures trade down from 3.00 to 2.00. But once we get over 3.00 the curve in HJ steepens. Notice above 3.00 HJ almost goes straight up. One important note, I transformed the HJ data to make it easier to read by plotting ONLY the 20 period avg of HJ prices at each corresponding spot price level of futures to make the data easier to understand and comprehend.
You are using an out of date browser. It may not display this or other websites correctly.
You should upgrade or use an alternative browser.
You should upgrade or use an alternative browser.
The ACD Method
- Thread starter sbrowne126
- Start date
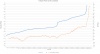
So this hopefully shows you guys the benefits of why trading energy spreads vs the outright can allow one a smoother payoff structure and in the case of HJ, owning upside curvature with a better risk adjusted payoff then sitting through the noise of front month futures. In the last week front month got destroyed falling from 3.36 to 2.85 in days. HJ traded right back down to it's baseline around .20.
Please keep in mind, as we get later into the season, HJ will become much more sensitive to changes though and if overall demand comes in light this spread will converge to the marginal cost of storage very quickly. Also the curvature changes as a function of price, the lower HJ gets, the steeper the slope gets as a function of time. As HJ gets expensive, the slope flattens and the payoff of the spread becomes more binary and replicates the risks of holding a front month contract.
That's it guys, hopefully that was worth the wait.")
Please keep in mind, as we get later into the season, HJ will become much more sensitive to changes though and if overall demand comes in light this spread will converge to the marginal cost of storage very quickly. Also the curvature changes as a function of price, the lower HJ gets, the steeper the slope gets as a function of time. As HJ gets expensive, the slope flattens and the payoff of the spread becomes more binary and replicates the risks of holding a front month contract.
That's it guys, hopefully that was worth the wait.
Brilliantly explained Mav a lot easier to understand than I had thought.
Thanks.
Thanks.
Thanks guys. Meanwhile the slaughter continues in natural gas.
..Meanwhile the slaughter continues in natural gas.
Will be interesting to see if /NG catches a bid heading into Thursday's inventory report....could see a huge pop if that report comes out better than expected. My 30D#L is still very strong, 10D is more neutral than bearish.
Mav, Thanks again (and again and again) for the education . What am I to make of the H/J 2018 spread trading around 50 cents the last few days? Is that normal?
Thanks OneFive. I suspect the bid in 2018 is LNG related. I know LNG exports are expected to increase substantially in 2018 and beyond which has to be factored into the supply situation. We have record supply in storage right now and over supply sooner or later tends to lead to tight markets so combine that with the LNG exports and you have a somewhat optimistic bid out in 2018.
[QUOTE
http://news.cqg.com/events/2016/09/trading-fisher-bars-acd-and-pivot-ranges
Mark B. Fisher, founder and CEO of MBF Clearing Corp, is one of the industry's leading traders and technical analysts.
CQG is excited to offer, in conjunction with Fisher, the MBF Chart. Mark Fisher uses Fisher Bars on the MBF Chart within the context of his ACD trading methodology to interpret price action, pivot ranges, and price levels for trading.
Watch Mark Fisher explain the new chart and how he uses it in our live webinar on October 6 at 10:30 a.m. ET.[/QUOTE]
Don't forget the rescheduled Mark Fisher webinar is tomorrow morning at 10:30 am ET.
The slaughter in natural gas continues going into delivery. I think some long funds got completely molested on this. Do not be long UNG. The roll yield is horrific right now and will be for the next 3 months. This is one of the biggest massacres in a while and they are calling for unseasonably warm temperatures the next week.