Quote from DrPepper:
Excellent post! Thanks for your reply. I was looking for other forms of technical analysis and you provided several that I do not use.
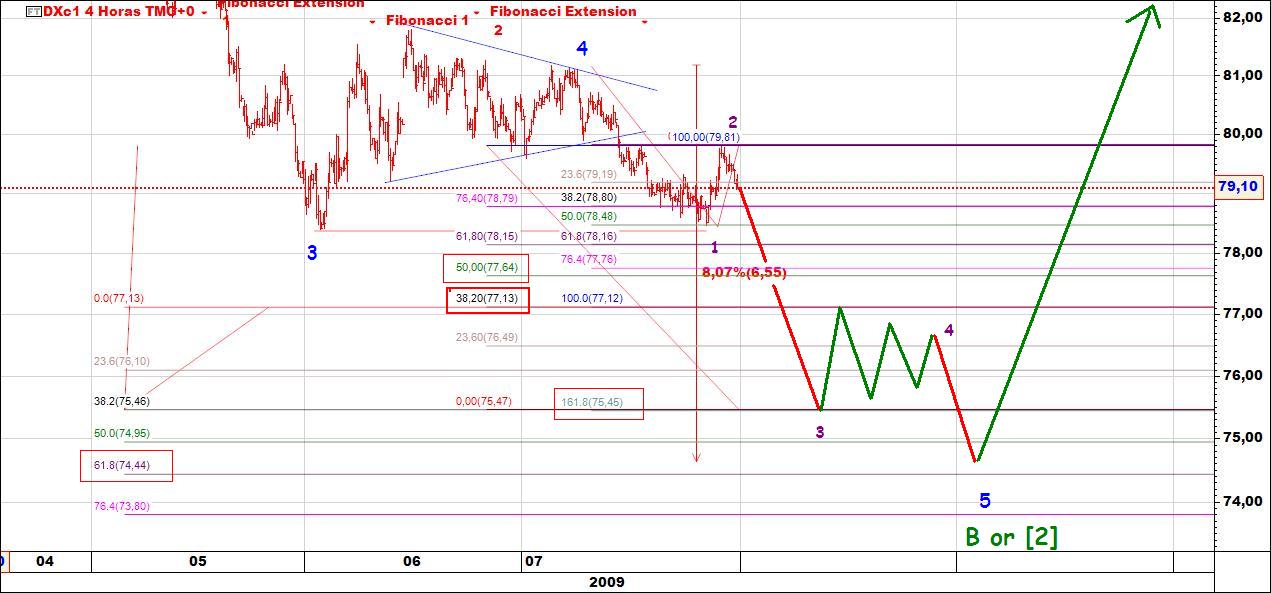
Is that a linear regression channel or a trend channel?
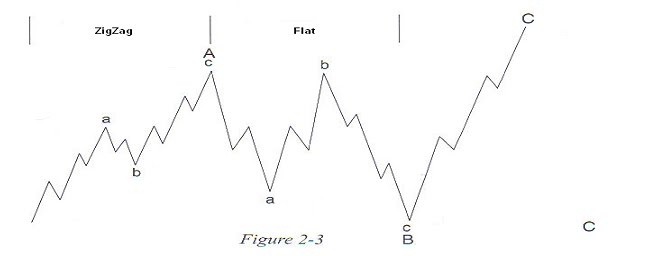
I assume that the wave analysis is Elliot Wave and that you drew a typical pattern found after the fifth wave. Is that correct?
What is the indicator at the bottom that shows the divergence?
Thanks.
Thank you.
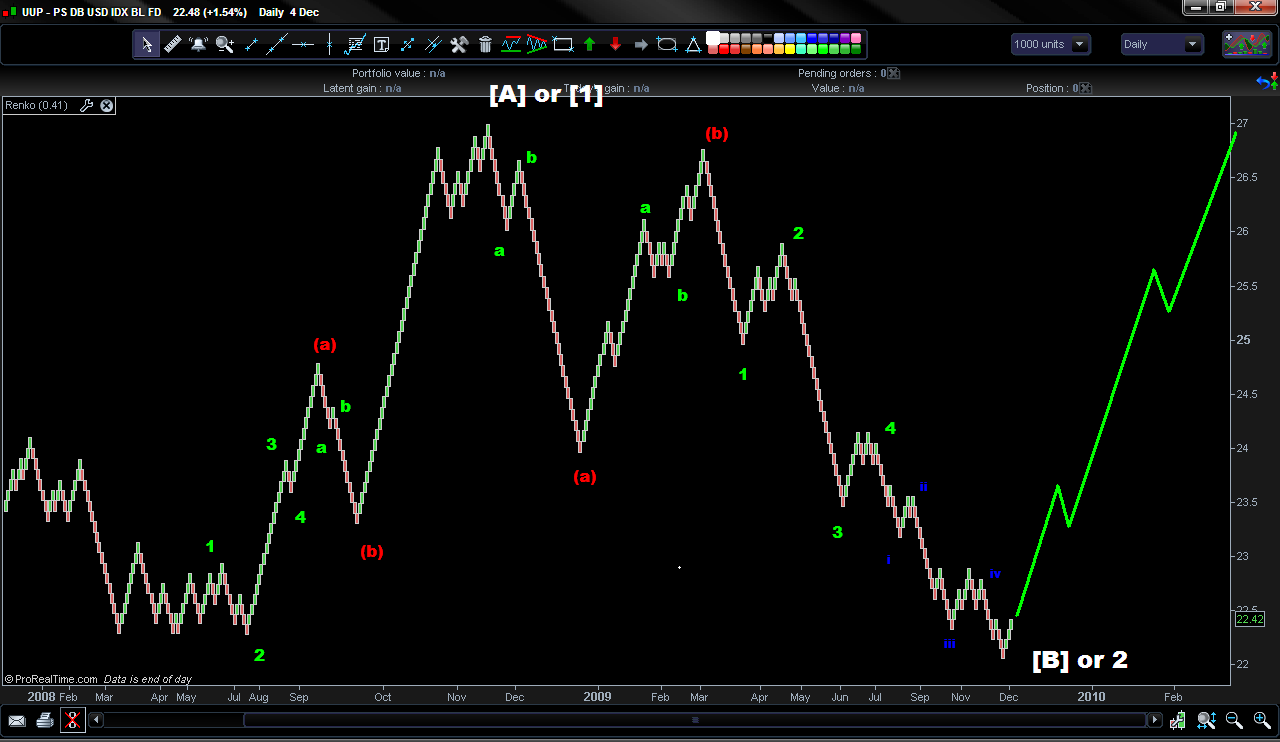
Yes it is EW. I do use EW on my long term bias, although I don't base my trades in it. So far it has proved to be good to me. I don't see why so many people are saying EW was dead after 2009 rally, when in fact it helped to get out of shorts near the lows and sto start accumulate stocks and ETF's around 710 points in S&P.
The channel is just a normal EW channel which connects wave 2 to Wave 4. From that then you draw a parallel to that channel that goes thru the top of Wave 3. The dashed line is just the mid-line of the channel.
The indicator is an indicator of my own, very simple, it takes the derivative of the derivative of price allied with some MA's.
If you take a derivative you get velocity, derivative of derivative you get acceleration. So what the indicator states to me, is the peak in strength was in wave 3 of 3 (which is to be expected) and it has been losing strength ever since... the recent divergence to me makes me think this is clearly a 5th wave. Especially after the sideways action we've had from 2008 and most 2009, which to me I evaluate it as a triangle which is always preceding the FINAL move of a trend.
")