It is interesting to read opposing views regarding the future direction of gold based upon fundamental and economic factors. I thought it would be interesting to get some views based upon technical analysis of the current gold chart. I have never posted a chart before, so I will post the chart first and see if it works. Then I will describe my analysis.
You are using an out of date browser. It may not display this or other websites correctly.
You should upgrade or use an alternative browser.
You should upgrade or use an alternative browser.
Technical Analysis of Gold
- Thread starter DrPepper
- Start date
From looking at the chart, I see gold is collapsing big time! Especially now that both the fundamental and technical aligned.
Some believe that gold is going to go as low as $700.
Some believe that gold is going to go as low as $700.
Starting with the weekly chart, notice that we are in a solid uptrend. Price has retraced to support (see dashed purple line) and stochastics is oversold. Notice that each time stochastics has been oversold during this uptrend, price has resumed its uptrend (see purple vertical lines). This is certainly no guarantee that the uptrend will resume, but it is a good place to buy a retracement in the uptrend with a tight stop below the prior low. Also, notice on the weekly chart that volume has been decreasing for the last few weeks, suggesting that there is not a lot of short interest. However, the light holiday volume is also a contributing factor. Also on the weekly chart, the seasonal tendency for gold to rise in price is still present. Actually, I use MRCI for seasonal tendencies, but I cannot print their chart, which shows the price of gold continuing to rise through the end of January.
On the daily chart, notice that we have completed an a-b-c retracement as marked. The a-b-c retracement tends to shake out the weak holders and is often a better entry. Now that price is also at support, it is any even stronger entry. In addition, there is bullish divergence on MACD as well as some other oscillators that I did not post for simplicity. We have also formed a swing low as price closed higher yesterday. However, price is still just below the 50 SMA, but it did close back above the bottom trend line.
However, I have 2 concerns about this being the bottom of the retracement. First, there was not a lot of volume with the higher close on 12-24. This is certainly understandable during the shortened holiday trading day. My other concern is with the COT report. Last week, it did not show a lot of commercial (smart money) buying and this week's COT report is delayed due to the holiday.
That is my current technical analysis of the weekly and daily gold charts. I would be very interested to see how others view gold technically if they are willing to share their own approach.
Quote from Arthur Deco:
Based on the top helper (price only) and the bottom helper (price and volume), clearly a sell.
On a daily chart, gold has made a lower high and a lower low, and is trading below the moving averages that you placed on the chart, which is what I assume that you refer to as a clear sell. But what about the weekly chart simply showing a pullback on lower volume in a clear uptrend? What about the fact that gold is trading at support?
What is it about the volume that indicates a clear sell to you? To me, volume appears to be decreasing, which would suggest that there is not a lot of professional interest in the downtrend. The recent green up-volume bars also appear to be higher than the red bars, again indicating more volume on up days.
Also, would you mind explaining the horizontal red/green stripes above and below your volume histogram?
DP, I cannot comment on the weekly chart because I don't believe I have any facility in interpreting it. I use the daily for all my investment decisions. The study above volume is a stoplight helper, "red light short, green light long, orange light stand aside." It merely interprets the price MAs. The bottom study interprets both price and volume using a personal adaptation of Jack Hershey's Price-Volume relation. My approach to gold is to buy physical periodically regardless of price. So the charting that I take seriously in stock investing I ignore for gold. Would I really sell now? Hell no! I'm a buyer!
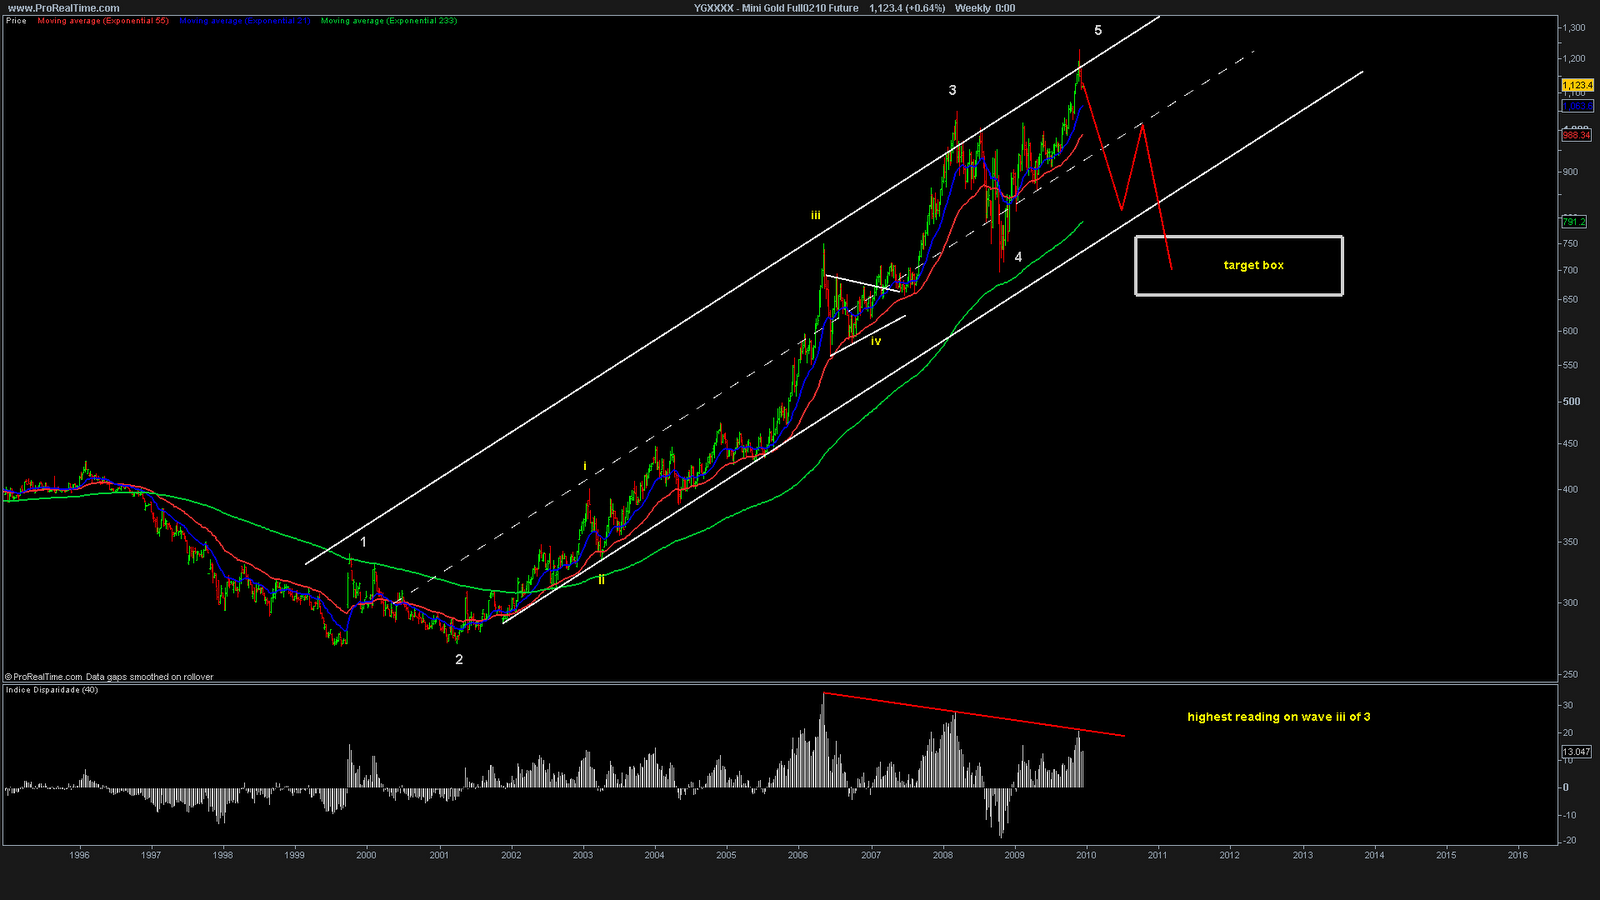
my view on Gold:
Excellent post! Thanks for your reply. I was looking for other forms of technical analysis and you provided several that I do not use.
Is that a linear regression channel or a trend channel?
I assume that the wave analysis is Elliot Wave and that you drew a typical pattern found after the fifth wave. Is that correct?
What is the indicator at the bottom that shows the divergence?
Thanks.
Is that a linear regression channel or a trend channel?
I assume that the wave analysis is Elliot Wave and that you drew a typical pattern found after the fifth wave. Is that correct?
What is the indicator at the bottom that shows the divergence?
Thanks.