If 4328 breaks, long on retrace. Alternatively, if 4300 breaks, short on retrace.The range at the open is 4300 to 4328. There is a hinge with an apex of 24. That's it. No other lines. No other considerations.
The bell is ready to ring. What are you going to do?

You are using an out of date browser. It may not display this or other websites correctly.
You should upgrade or use an alternative browser.
You should upgrade or use an alternative browser.
switching gears to Price Action via SLA
- Thread starter gears
- Start date
With regard to prep and analysis after the Friday, 3/27/15 session. I wanted to keep this handy in my journal so perhaps I'd use it as a guide for my viewing of what's transpired and how to rate importance to levels.
As for the "limits of the Range", bear with me.
There are a multitude of limits that you could plot here and the more limits, the more ranges. Exponentially more. You don't need this hassle at the open, not when you're trying to judge what it is that traders want. Therefore, look at what makes the most sense.
First, note that 27+ is tested twice on Friday. This is the level beyond which buyers will not go. It is not until the end of the day that buyers for whatever reason are willing to pay the ask. Friday Fever. Who knows? But what is most important is not that buyers are willing to pay more than 27+ but that their fever is so short-lived. That and the fact that there aren't enough of them so that sellers can move price higher. So price falls all the way back to 20. This confirms the strength of 27+ and discourages raising the level of the range to 32+, much less 33+. And when you have to make a quick decision as to whether to enter a reversal or not, 6pts is a lot of wiggle room.
Therefore, when assessing the probabilities, I suggest that 27+ is the upper limit. That reduces the number of potential upper limits from 3 to 1.
As for the lower, note that price dips below your line by barely a point. However, it dips below 00 considerably more than that. And spends 10+ minutes down there. But sellers aren't willing to lower the ask.
Next test? It hits 00 exactly. But there are two elements to this: one, that it reversed at 00 and two, that it did not dip below 00 a second time. Each of these elements provides a slightly different message.
And the test after that? Price dips below 00 again, but not nearly as far and for not nearly as long. Therefore, what is erecting the barrier? What is the price that everybody has his eye on? Again, this reduces the number of lower limits from 3 to 1. So now, instead of 3 upper limits and 3 lower limits and the many combinations that can be provided with so many, you have 1 and 1, and they can be combined only one way.
If don't want to trade reversals, you're faced with the prospect of doing nothing unless and until price at the very least breaks through 27+ or 00. This is an opportunity to practice transforming inaction into a tool. Use this time to observe. What are traders doing? What is the pace? What is the activity level? Are there a lot of gaps in the tick (is price shooting up and down instantly)? And how are they treating the equilibrium level (24) during all this?
Given all of that, what do you plan to do if and when price breaks through 27+? Are you going to take it? Or are you going to wait to see what happens at 32? Or are you going to wait and see what happens at 33+ (which is by now more than 6pts past 27+)?
Same questions for the lower limit(s).
According to what Db just posted in The Foresight Thread, my DL isn't drawn correctly as I started it inside the range. It is modified on my computer screen, just not in the attached picture.
I'm taking a page from @lajax and using his markers to visually express where I am planning to take trades and what price will do around those areas to cause me to enter. This week it's been suggested that I only trade from an identified level if price comes within two ticks of that level. I believe it's to help/train me in a few ways: 1) I have to be rather precise in determining my levels, 2) I have to be patient to wait until price gets there or beyond, and 3) I'll be practicing not doing anything even if price behaves as I'd expect near the level, but say 2 points away. Learning to NOT trade is a biggie right now.
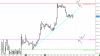
I'm taking a page from @lajax and using his markers to visually express where I am planning to take trades and what price will do around those areas to cause me to enter. This week it's been suggested that I only trade from an identified level if price comes within two ticks of that level. I believe it's to help/train me in a few ways: 1) I have to be rather precise in determining my levels, 2) I have to be patient to wait until price gets there or beyond, and 3) I'll be practicing not doing anything even if price behaves as I'd expect near the level, but say 2 points away. Learning to NOT trade is a biggie right now.
So it's sort of early to be posting my results, but I took two trades (should have been 3) and I don't want to push my luck any further.
I had identified 4367.50 as the overnight high. Price hit it, took a breather and then headed up. I decided to take a BO trade since the LOLR had been up for a while (4368.50). I changed my targets a little (5 point stop, 6 & 12 point targets with stop for 2nd contract moved to +5 ticks after the first target is hit). I'm using the trading mechanism through SC for a few reasons - one is to keep me accountable - to myself and when posting in my journal. I don't have anything to prove to anyone other than myself, but keeping me in check is a good idea for me right now.
First trade = according to plan = check!
My second trade is more in line with how I tend to work - the RET after the test from the BO. So I got in at 4370.00. This trade caused more heartburn as it tested the overnight high area for a little bit. I hung in there (and no, I don't need a medal or anything - it's just good for me to set a trade and let it work). Like the first trade, the first target hit and the 2nd hit the modified stop.
Second trade = according to plan = check!
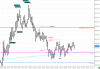
The third trade is a CWS trade… I didn't take it even though it set up exactly like I'd have wanted it to - a LH at a predefined area. However, I let my head get in the way. I'd taken two trades and they'd worked (didn't want to give $ back) AND I had a bit of a long bias. I know, I know - two things I can't do when trading. However, I marked where I 'should' have entered. Granted, this trade would have given me quite a bit of heartburn for the first 5 or so minutes, but like the two trades I did take, it would have hit my first target. It did show me that my instincts are getting there, but instincts don't hit the buy/sell button.
Third setup = didn't pull the trigger = NOT according to plan = demerits.
Like Jsmacksem said:
Certainly better than Friday, but I've got to prove it to myself that I can do this on a regular basis.
I had identified 4367.50 as the overnight high. Price hit it, took a breather and then headed up. I decided to take a BO trade since the LOLR had been up for a while (4368.50). I changed my targets a little (5 point stop, 6 & 12 point targets with stop for 2nd contract moved to +5 ticks after the first target is hit). I'm using the trading mechanism through SC for a few reasons - one is to keep me accountable - to myself and when posting in my journal. I don't have anything to prove to anyone other than myself, but keeping me in check is a good idea for me right now.
First trade = according to plan = check!
My second trade is more in line with how I tend to work - the RET after the test from the BO. So I got in at 4370.00. This trade caused more heartburn as it tested the overnight high area for a little bit. I hung in there (and no, I don't need a medal or anything - it's just good for me to set a trade and let it work). Like the first trade, the first target hit and the 2nd hit the modified stop.
Second trade = according to plan = check!
The third trade is a CWS trade… I didn't take it even though it set up exactly like I'd have wanted it to - a LH at a predefined area. However, I let my head get in the way. I'd taken two trades and they'd worked (didn't want to give $ back) AND I had a bit of a long bias. I know, I know - two things I can't do when trading. However, I marked where I 'should' have entered. Granted, this trade would have given me quite a bit of heartburn for the first 5 or so minutes, but like the two trades I did take, it would have hit my first target. It did show me that my instincts are getting there, but instincts don't hit the buy/sell button.
Third setup = didn't pull the trigger = NOT according to plan = demerits.
Like Jsmacksem said:
"Do or Do Not. There is no try." -YODA.
Certainly better than Friday, but I've got to prove it to myself that I can do this on a regular basis.
Chasing price is a serious account killer. The professionals know that the best way to get an excellent entry price and accumulate fuel for the next move is to create a bid/offer vacuum that causes price to move quickly. Since so much trading is programmed trading now, these intense moves happened incredibly fast. This is why when you chase price, you very often end up entering very close to a high or low tick of a swing.
This is also why it's so easy to see what to do on a static chart after the fact, but so difficult to actually do it in real time.
"In the market environment you have to make the rules to the game and then have the discipline to abide by these rules, even though the market moves in ways that will constantly tempt you into believing you don't need to follow your rules this time. This movement allows you to indulge in any illusion or distortion that suits you in any given moment."
- Mark Douglas (The Disciplined Trader)
This is good--- you are on the right track with this thought process.
surf
Last edited:
Kind of a mixed bag today for me. Took 3 trades - 2 went well and the first one hit my full stop so I started out down.
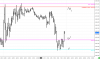
First trade wasn't exactly the entry I should have taken. It was near a level I'd identified, but the PA was more of a BO than a retest of the level. I'm not as comfortable with BOs.
Second trade was off a RET from a test back at 4354. First target was hit and then 2nd revised stop was hit. Price wasn't having much luck going beyond the 4364 level (overnight swing).
Third trade was almost a repeat of the 2nd trade - RET after a test of 4354. Same results of trade two also - again with 4364 acting almost as ceiling.
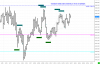
Obviously hindsight is fantastic and now seeing the almost parabolic move down to and through 4348, I was on the lookout for a REV, but I didn't take it. It sliced through the area so definitively that it 'felt' like traders were in a frenzy to push price lower. So I waited. And price kept making HHs and HLs - but then it was too late. I'm thinking @fortydraws will make mention of the PA at 0950/51/52 being a common NQ REV price pattern and that I should replay it 50x to be more aware the next time I see it. I will have to do just that.
First trade wasn't exactly the entry I should have taken. It was near a level I'd identified, but the PA was more of a BO than a retest of the level. I'm not as comfortable with BOs.
Second trade was off a RET from a test back at 4354. First target was hit and then 2nd revised stop was hit. Price wasn't having much luck going beyond the 4364 level (overnight swing).
Third trade was almost a repeat of the 2nd trade - RET after a test of 4354. Same results of trade two also - again with 4364 acting almost as ceiling.
Obviously hindsight is fantastic and now seeing the almost parabolic move down to and through 4348, I was on the lookout for a REV, but I didn't take it. It sliced through the area so definitively that it 'felt' like traders were in a frenzy to push price lower. So I waited. And price kept making HHs and HLs - but then it was too late. I'm thinking @fortydraws will make mention of the PA at 0950/51/52 being a common NQ REV price pattern and that I should replay it 50x to be more aware the next time I see it. I will have to do just that.

One of many flaws, I guess.
It will be fatal if not cured.