If an extreme results in a REV, there usually isn't a ton of time to think about it. It happens. Price gets there and there's almost a palpable "hell no" and price moves away. Is that what you were asking?Did you notice any difference in how price behaves at the real extreme as opposed to what you only thought might be an extreme?

You are using an out of date browser. It may not display this or other websites correctly.
You should upgrade or use an alternative browser.
You should upgrade or use an alternative browser.
switching gears to Price Action via SLA
- Thread starter gears
- Start date

If an extreme results in a REV, there usually isn't a ton of time to think about it. It happens. Price gets there and there's almost a palpable "hell no" and price moves away. Is that what you were asking?
The foresight chart may be found here. Note that it was posted at 0514 before the support at 13 was confirmed.

I worked through the morning of 12/3/13 to watch price and see how it behaves. Attached is my chart with areas marked and what was going through my head at those places. I can honestly say that I don't know if my SL and DLs are drawn correctly, if I've fanned when appropriate, if I've assumed a real direction change when I should have still been considering the previous direction. But here are my thoughts:
- EOD on 12/2/13, there was a pretty aggressive down move.
- Bit of a rebound overnight, but the balance seems to favor the sellers before the open.
- The low from 12/2 had been met, exceeded, bounced off of, etc. (solid red line). That price point was returned to repeatedly. Will that be a point of congestion going forward?
- Buyers and sellers have settled into a 3-5 point range in the few hours prior to the open (dotted red line).
I'm trying to draw conclusions regarding price movement. Drawing conclusions is not so I can predict patterns, but so I can be aware of behaviors. When an aggressive move occurs, there tends to be an equal, but opposite movement. Looking for that opposing movement helps me to feel more comfortable with it rather than fear it. I need to keep working with that thought in mind. I used the word, 'expect' in that regard as it helps me to plan for it rather than be surprised/disturbed by it.
- First breakout of that range occurred at 0918. Buyers trying to take the lead.
- Trendline break. Not sure if it can count as a DL yet as it's the first time price exited the prior range.
- HH - seems to validate the DL
- Immediate DL break
- HH - price moved above and below the DL
- Price is quite a distance from DL, but fanning it would seem to defeat the purpose of having it.
- Price retreats all the way back to the original DL.
- Feels like the bottom dropped out. Definitive break of DL and down TL can be drawn.
- Red line again met and exceeded
- SL break but couldn't make LL
- Significant retrace followed by LL
- SL broken, retrace and the dog barked - DL in place
- Minor retrace - well inside the DL
- HH and DL break
- Definitive DL break
- Same high - fan DL or only do so if HH?
- Retrace, but couldn't go lower than LSL
- HH - permission to fan DL - big price push - would tend to expect seller pressure in response
- DT?
- Exits DL, but now lower than LSL
- Can draw down trend line. Definitive DL exit. Sharp price rise. Thinking RET, but not sure if it would be for an up move or a down move. No certainty felt here.
- If turning south, strong pressure to bring prices back up, but no HH.
- HH - expect decent pull back. With new HH, drew 'revised' DL from #21 area.
- Close outside revised DL
- RET for either up or down
- LL - dog barked??
- Immediate SL break
- DT or previous up thing?
- Feels like a hinge
- Hinge fakeout?
- SL break
I welcome comments from those working with SLA on my thought process.
What you see on that day is that the instrument is in a decided up trend on the daily chart and the hourly and 15 are also in agreement. When drilling down here to the 1 min chart, you have a seriously oversold condition at number 11, with an upside reversal on the next bar. That would be the buy signal. Your initial sell stop should be placed at 3473.00. Then, you could trail a stop up under bar 14.5 although as you can see, the stop at 3473.00 would have lasted for the entire period of the chart. The diagonal line which extends from the bottom and touched the bottom of bar 17 and then touches the top of bar 22, is too steeply drawn and those types of trendlines will have you making more trades than necessary and paying extra commissions. Rather, a better line with a more shallow angle touching the bottom of 21 and 26 would help keep you in the trade and reap a large benefit. Reality of the matter though is that we were in an uptrend and there never was an overbought condition in this period and there was no sign of reversal. So, the stop at 3473.00 and then a stop below 14.5 would be all that would be needed to let this play out. Once an overbought condition with reversal implications presented itself, then profits could be taken, or you would just let yourself be stopped out for a gain.
What you see on that day is that the instrument is in a decided up trend on the daily chart and the hourly and 15 are also in agreement. When drilling down here to the 1 min chart, you have a seriously oversold condition at number 11, with an upside reversal on the next bar. That would be the buy signal. Your initial sell stop should be placed at 3473.00. Then, you could trail a stop up under bar 14.5 although as you can see, the stop at 3473.00 would have lasted for the entire period of the chart. The diagonal line which extends from the bottom and touched the bottom of bar 17 and then touches the top of bar 22, is too steeply drawn and those types of trendlines will have you making more trades than necessary and paying extra commissions. Rather, a better line with a more shallow angle touching the bottom of 21 and 26 would help keep you in the trade and reap a large benefit. Reality of the matter though is that we were in an uptrend and there never was an overbought condition in this period and there was no sign of reversal. So, the stop at 3473.00 and then a stop below 14.5 would be all that would be needed to let this play out. Once an overbought condition with reversal implications presented itself, then profits could be taken, or you would just let yourself be stopped out for a gain.
None of what you say has anything to do with what we are doing here. Why not go back to worrying about how you're going to make back the 50 or 70 ES points you are down in the week? Gears, you ought ot just hit report and ask that this guy's posts get deleted. His mumblings can only throw you off course, even if you do not think they will.
Different than what I see.What you see on that day is...
I'm glad you're such a fan of posting in other's journals, but I'd prefer if you focused your attention elsewhere. I explicitly stated that I welcomed comments from those working in a similar (trading) universe as myself. You've made it plainly clear in about 20+ posts around ET that you use 2% of your capital to work for you. That is NOT my approach and I'd appreciate it if you'd move on. Many thanks...
Different than what I see.
I'm glad you're such a fan of posting in other's journals, but I'd prefer if you focused your attention elsewhere. I explicitly stated that I welcomed comments from those working in a similar (trading) universe as myself. You've made it plainly clear in about 20+ posts around ET that you use 2% of your capital to work for you. That is NOT my approach and I'd appreciate it if you'd move on. Many thanks...
He seems to put those to whose journals he posts on Ignore since he never responds to anything they say. Therefore, your focus will likely be substantially improved if you just put him on Ignore (since I closed my threads, I don't have to deal with this anymore
 ).
).I think I got a little lucky today and that's not the kind of trader I want to be.
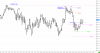
During the overnight hours, price made a high of 4461.25. In fact, that high occurred just prior to the NY open. Price had fallen back a bit and at 0930, traders made a push to bring it back up to that level. It didn't happen. Price started heading down, but didn't do so with one specific direction in mind. It went down, but slowly and with resistance.
Price made a low at 4448.75 and then 7 minutes later visited that same area, but couldn't make more than 2 ticks of progress before shooting up in rejection fashion. At 1026, price made yet another venture to that lower area and this time, 4448.25 was again hit. But traders didn't want to be there. So they headed back up.
This is where I ended up putting on a trade and getting a little lucky, but perhaps not. From what I had seen, 4461.25 was a ceiling and 4448.25 was the ground floor - effectively price was in a range. So when I saw price shoot up TO 4461 and not be able to get that extra tick, then move downward a bit and then form a LH at 4460, I figured there was a pretty high probability that price would move down. So I took a trade at 4458. I started out with my plan of taking profits at 5 points (4453) and the 2nd set of profits at 10 points (4448). Well, things started out pretty good. Price pretty quickly hit my first target. But then the PA told me that continuation wasn't likely. A brief pause is one thing, but when there's more sideways movement than directional movement followed by just a stab down of one more tick - price is telling me that my trade is failing. So I moved my stop to 4454 because if price would hit that level after just one tick in my favor (4450) after the HL, I figured it was time to stop and wait. The stop was hit and price continued all the way back up to just shy of the overnight high.

I ended up doing alright here, but it isn't the kind of trade situation I want to get in too often. The range wasn't even 15 points. A little too tight for me with my preferred profit targets. I didn't follow my plan to a T. The good thing about that was that I was reading PA pretty well.
So, pretty ok session for a Friday - especially for me. But no, I'm not patting myself on the back - at all.
During the overnight hours, price made a high of 4461.25. In fact, that high occurred just prior to the NY open. Price had fallen back a bit and at 0930, traders made a push to bring it back up to that level. It didn't happen. Price started heading down, but didn't do so with one specific direction in mind. It went down, but slowly and with resistance.
Price made a low at 4448.75 and then 7 minutes later visited that same area, but couldn't make more than 2 ticks of progress before shooting up in rejection fashion. At 1026, price made yet another venture to that lower area and this time, 4448.25 was again hit. But traders didn't want to be there. So they headed back up.
This is where I ended up putting on a trade and getting a little lucky, but perhaps not. From what I had seen, 4461.25 was a ceiling and 4448.25 was the ground floor - effectively price was in a range. So when I saw price shoot up TO 4461 and not be able to get that extra tick, then move downward a bit and then form a LH at 4460, I figured there was a pretty high probability that price would move down. So I took a trade at 4458. I started out with my plan of taking profits at 5 points (4453) and the 2nd set of profits at 10 points (4448). Well, things started out pretty good. Price pretty quickly hit my first target. But then the PA told me that continuation wasn't likely. A brief pause is one thing, but when there's more sideways movement than directional movement followed by just a stab down of one more tick - price is telling me that my trade is failing. So I moved my stop to 4454 because if price would hit that level after just one tick in my favor (4450) after the HL, I figured it was time to stop and wait. The stop was hit and price continued all the way back up to just shy of the overnight high.
I ended up doing alright here, but it isn't the kind of trade situation I want to get in too often. The range wasn't even 15 points. A little too tight for me with my preferred profit targets. I didn't follow my plan to a T. The good thing about that was that I was reading PA pretty well.
So, pretty ok session for a Friday - especially for me. But no, I'm not patting myself on the back - at all.
Don't you ever sleep? If I remember correctly, you're in NM so 0700 is 0500 your time. I'm not a functioning human being at 0500.Shoulda been up at 0700
Don't you ever sleep? If I remember correctly, you're in NM so 0700 is 0500 your time. I'm not a functioning human being at 0500.
Farmer's hours. But I suspected that since we'd spent so much time ranging, there might just be a decent move upward today. I didn't expect it at 0730, but the retracement was there, so . . .
Not that getting up early is always a plus. Anyone who bought the breakout, say in Europe, would have been sitting on it for 2.5 hours (0400 - 0640) waiting for it to do something.