Steve,
3 problems: a summary of what everyone is saying.
- Lagging indicators (EMA and Stochastics). You can work with them, but have to know they are behind by more than the time period of the bar. Usually you need the completed bar and the next bar to confirm. Too easy to undo the signal.
- The 5 will tell you enough about the 15 you don't need it. It will not get you more "correctness". But the daily is important.
- You need more than these as input. Sure they will show signals, but they will show more false positives and that will result is a lot of negative (lose-stopped) trades. You can try additional filters, but by then you have a lot of stuff going on. Simple is better.
One last thing, there was a guy who did 5-15-30 and MACD. He used to get excited about when the all aligned and call it a "perfect storm". But the truth was, it was obvious before the alignment and the alignment was too late to be tradable, so you got into it late when it was pausing, or bouncing, or even reversing. So the trades were 30% wins (continuation after the pause), 30% stopped or sub optimal entry (bounce), or 40% a straight up loss (reverse). That is not the "advantage one can "trade.
Thank you for flushing this out a bit more for me. To maybe help give more context, I have been trying to get into a straight call or put at or after the open on momentum plays (based on a catalyst) with weekly options from 9:30 - 11 AM. So I am trying to watch for some sort of confirmation that tells me to enter on the stock price to then buy a contract (just buying 1 for now) and then sell the contract to close the position.
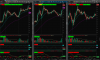
I attached a trade on AFRM from Thursday 10/7. I ended up stopping out of it and took a 20% loss on it - that 2nd red bar on the 5 min took me out.
As I go back to look at the 5 minute chart, the 3 EMA wasn't above the 8 EMA or 21 EMA until 9:45 AM. I was thinking that at that point, it would have been my entry when that alignment occurred. What makes it challenging is I feel like I don't have a checklist (which I am trying to create visually with those EMA boxes and other box indicators) to let me know things are more favorable to enter on a position, but it may be all wrong.
I am also noticing that it seems like the K>D on the 15, 10, and 5 (but especially higher timeframe of the 15 that K is over D that the price seems to move up).
I try to look for above average volume coming in.
As a bit of history, I picked up the 3 EMA concept and 8 EMA from watching some videos from Steve Bigalow. I picked up the MACD and Stochastics from Dr. Barry Burns as I had bought one of his programs, but I can't seem to trade his system as it gets into so much cycle lows and highs and wave counting.
Honestly, I am just all over the place just trying to find a strategy that can work for me, and have been failing at it - that has been the truth. This is why I need help from those of you who know what you are doing and are successful with it.
How can I go about getting corrected to institute something that can work? Is there a framework that I can operate off of?
Thanks to everyone for trying to help me,
Steven