You are using an out of date browser. It may not display this or other websites correctly.
You should upgrade or use an alternative browser.
You should upgrade or use an alternative browser.
start with a blank canvas
- Thread starter ammo
- Start date
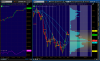
OK, here is my first attempt at hand drawing a Market Profile. It’s for the past two days on the SPX-500. It is on graph paper but the lines haven’t shown up on the copy.
I didn’t draw this real-time, I drew it from a spreadsheet with the data on. However I covered the sheet and revealed the relevant data one line at a time, so I couldn't see what was coming. So as near to real-time as possible.
First observations are:
That it is rather enjoyable to do, quite relaxing even. Much more involved than just watching price move on a screen.
The lack of context, (just a blank page) makes one focus solely on price and what it is actually doing now.
As far as patterns or the structure of the charts, I think I will have to keep practicing and making observations and comparisons before I can start gleaning anything meaningful.
Thanks.
Thank You Ammo,sph's spm's spu's and spz's, when the futures came out had mar june sep and dec exp , the easiest nickname of those 4 exp's was spu , hence spu's, what are the spu's doing meant current nearest exp
You're supposed to flatten all the letters to the left of the chart, overlapping each other.OK, here is my first attempt at hand drawing a Market Profile.
View attachment 143428
It is a chart of distribution.
Code:
A
A
AB
ABC
ABC
AC
C
CD
CD
CDEFGH
DEFG
EF
EYou're supposed to flatten all the numbers to the left of the chart, overlapping each other.
Code:A A AB ABC ABC AC C CD CD CDE DEE E E
Ah, ok great, thanks for that! Will incorporate that in the next charts. Always learning.
However, I was going on the example from the CME group educational material on their website, and they don't flatten it in the examples.
http://www.cmegroup.com/education/interactive/marketprofile/
OK, I'll push all the prices to the left in future. Thanksthe pushing of all the prices to the left gives you the formations, not sure why they gave that as an example, half pushed to the left and half of it trailed off
in sim, you can use those formations to day trade, as that chart builds it will leave gaps make ledges and nips and as the day progresses it will back fill the picture a large percentage of the time, you can take the same principles and apply it to a multi day picture and use the 2 together, by doing this in real time you will see it repeatedly extend or drop to predetermined spots and that is your edge
i dont use the volume on the mp, if you have the volume bars at the bottom of your chart you can look for volume spikes at the wide nips or deep cleaves for confirmation
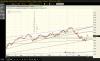
if you are looking at a 90 day or 6 mo spx chart , the spx doesnt have volume, since the es is an always changing value against the spx and changing contract months, i get a better read watching the spx and subtracting for the es value
i dont use the volume on the mp, if you have the volume bars at the bottom of your chart you can look for volume spikes at the wide nips or deep cleaves for confirmation
if you are looking at a 90 day or 6 mo spx chart , the spx doesnt have volume, since the es is an always changing value against the spx and changing contract months, i get a better read watching the spx and subtracting for the es value
Last edited: