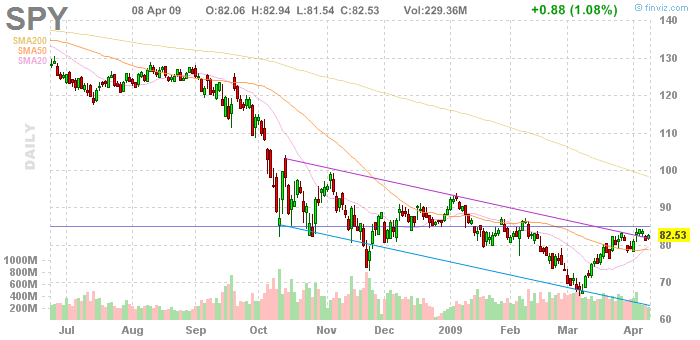
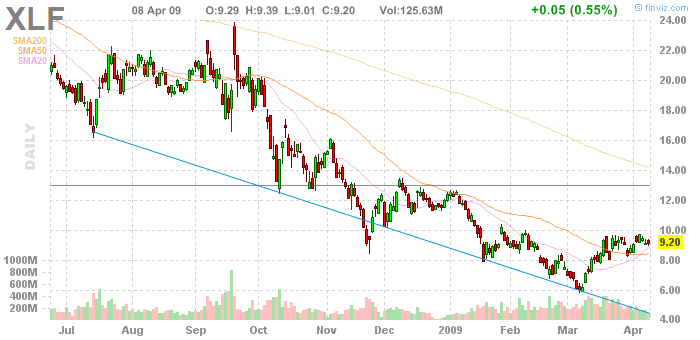
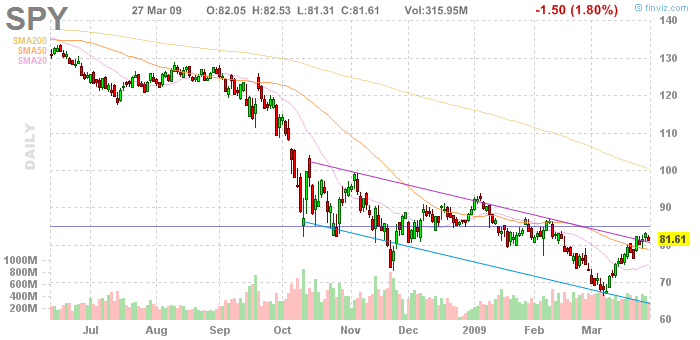
I believe we have finally reached the bottom of this bear market. I think bear market is over. Just look at the charts, they speak for themselves:
Dow Jones Transport also have rallied.
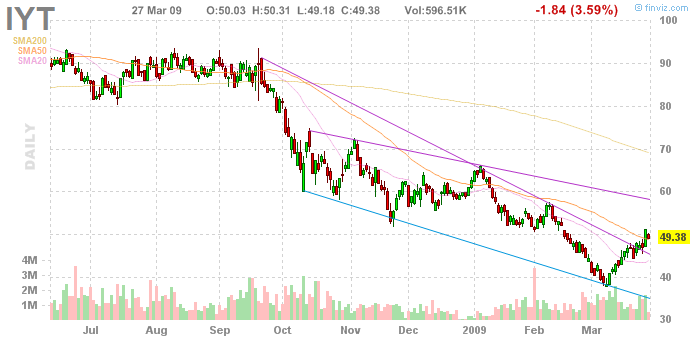
This is a very sure sign that the bottom is finally in.
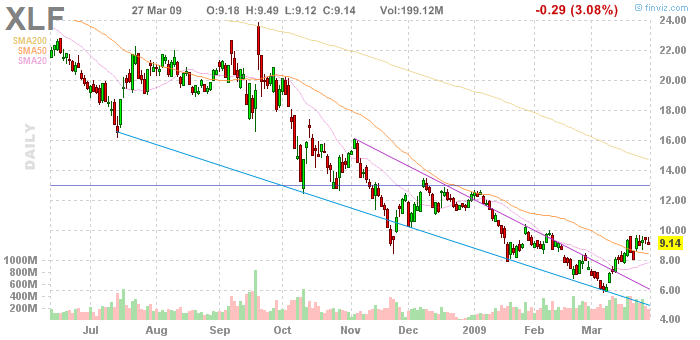
For S&P I have a minimum target of 1050 by July, XLF target 25. See the gap there? It will be filled very soon now.
I'm fully invested now and will not sell. I believe Obama and Geithner will make this economy so much better.
Other stocks: AAPL, GOOG.
Short-term (6 weeks) target for AAPL: $140, GOOG: $390.
QQQQ should be able to close the gap at $35 and skyrocket higher.
Buy the dip at any pullback, fellow traders. I was a bear but I now realize that this rally is for real")
Dow Jones Transport also have rallied.
This is a very sure sign that the bottom is finally in.
For S&P I have a minimum target of 1050 by July, XLF target 25. See the gap there? It will be filled very soon now.
I'm fully invested now and will not sell. I believe Obama and Geithner will make this economy so much better.
Other stocks: AAPL, GOOG.
Short-term (6 weeks) target for AAPL: $140, GOOG: $390.
QQQQ should be able to close the gap at $35 and skyrocket higher.
Buy the dip at any pullback, fellow traders. I was a bear but I now realize that this rally is for real