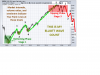
Spot the Bear. Weekly chart analysis of S&P500

That's NOW !! So time to buy ?

If Brexit is not passed, this market will soar.....at least temporarily.
There are so many headwinds....consumer confidence, retail sales, Chinese economy, price of copper, US job market, negative interest rates...
They just keep coming.

I love the one comment on CNBC today: "This market is whistling past the graveyard".
Indeed, it is remarkable how well it's holding up.

I believe they allow for the cycle's to "invert" from time to time...One of the guys that I follow had a window for the market topping at the end of May (and then continuing lower thru the rest of the year)...He was off (it appears currently) by a week, however in the past he has had some very accurate predictions (E-Wave combined with Hurst cycle analysis)...Granted, this stuff is just noise for most of us, since it's very hard to hold positions in this current environment for long periods of time...
 
Can you imagine the relief rally if this Brexit thing doesn't go ahead.
All will be revealed June 23rd.
 
Can you imagine the relief rally if this Brexit thing doesn't go ahead.
All will be revealed June 23rd.
New all-time highs likely.
Still, a good shorting opportunity IMHO....that move would be all psychological....
nothing has changed FUNDAMENTALLY:
1) negative overseas interest rates
2) copper price below cost of production
3) shaky US labor market
4) shaky US retail figures
5) crude oil prices have stopped rising
6) China continues to rig their economic numbers
 
To me, the S&P on a monthly chart is showing a substantial distribution pattern, each time it fails to hold onto new highs is another nail in the correction coffin.

I saw this chart online and thought it was a bit much but non the less it was interesting to see it. Don;t know what would trigger that but maybe if Trump make presidency ;) ??? "Trade what you see"
Chart S & P.png
 
Back
Top