
Spot the Bear. Weekly chart analysis of S&P500

1sma?
Hello romik, 1 sma for me starts the binary process. The process for determining whether the market has strength or weakness.
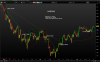
This is not my entry process just an initial determinant. In viewing my chart posted in # 186 you would never be trading against the trend had you traded above or below the sma. Surely this is not a new concept for you. Perhaps you were thinking it was my whole trading method.
See chart for entry / exit examples, this is a universal system for all futures.
 

Attachments
  • NASDAQ.png
    NASDAQ.png
    118.5 KB · Views: 30
Last edited:
I can't see 1 period SMA on your chart. What is the probability rate of your method?
There is a blue and yellow SMA it's the blue one the yellow one should not be on that chart my mistake. Here in this thread I did a back test, this system I use is not new to me but new in the refining stage, back testing and optimization. (post #14) Just to clarify the SMA is 70 not 1. 1 describes the # of SMA's on the chart is all.
http://www.elitetrader.com/et/index...is-not-very-bright.298446/page-2#post-4257881
 
There is a blue and yellow SMA it's the blue one the yellow one should not be on that chart my mistake. Here in this thread I did a back test, this system I use is not new to me but new in the refining stage, back testing and optimization. (post #14) Just to clarify the SMA is 70 not 1. 1 describes the # of SMA's on the chart is all.
http://www.elitetrader.com/et/index...is-not-very-bright.298446/page-2#post-4257881

OK, so it's 70SMA. Your test was run just over 1 day? You need hundreds of days to establish probability. I wouldn't be surprised that using this on a 5 minute chart will be a net losing system at 1:1 payout. Some days you'd get whipsawed a lot, those days will be the catalyst of a 1:1 payout strategy, as they will most definitely reduce your probability to below 50% especially after costs.

Test it in real-time if can't backtest over a large sample rate.
 
Not one day from Feb 16th but I inputted from 2015 anyway this software has allot of limitations for back testing. Can you run a back test it is simple inputs.
I just wonder if your software would give a diff result
 
the reason it works is in a trending market, (index above 50 day SMA), the price variance from the high on average would not exceed 60 points. (30 points for entry from high) and (30 points from entry to stop loss)...

try it out... the recent high on march contract was around 2007, -30 = 1977 for entry, and 30 for stop loss is 1947... ..the price went to 1968 and rebounded and hit TP at 2007. (march contract).

the next implied trade is .. 2012 - 30 = 1982 for entry..1952 for stop loss..
 
the reason it works is in a trending market,
Right in this statement is a secret to trading a market that's trending and I've noticed it before.
In an up trending market you take the price cross up threw your chosen MA
In a down trending market you take the price cross down threw your chosen MA
The most important thing to identify is which way the trend actually is, if in doubt stay out.
Just part of the system there are other filters to apply.
MOST important not to trade against the trend, believe me that is hard some times, you can be a bit late in flipping your position and be behind the 8 ball real quick
 
I couldn't help with a backtest, you'd need something like a Tradestation to perform a solid backtest. 1:1 payout is very low payout schedule, so a backtest is a must.
 
That's what I am trying to say here, how do you foresee what's going to trend and what isn't? Non-trending times will kill this strategy IMO.
Well really there is no foreseeing is there, only once price crosses a trend line and sma on a higher time frame then the lower time frame is in that trend. trade accordingly then long or short.
Then there are reversal signals a whole other discussion
 
Back
Top